


Winter ends with stable electricity prices
Electricity prices across Queensland, New South Wales, Victoria, and Tasmania remained stable throughout August, closely aligning with July levels. Volatility was limited, with sufficient generator availability and the absence of extreme winter weather helping to avoid significant market stress.
The spot price in New South Wales peaked in mid-August at $1,119/MWh. Meanwhile in South Australia, after experiencing significant volatility in early July, saw its average wholesale price fall by half in August, making it the second-lowest priced state for the month.
High FCAS costs in South Australia
To maintain grid stability, the National Electricity Market (NEM) relies on Frequency Control Ancillary Services (FCAS), which ensures generation and load remain in constant balance around the 50 Hz system frequency. FCAS acts as a rapid response reserve, activated to minimise frequency deviations caused sudden generation or load changes. A failure to maintain frequency can lead to cascading outages and black outs.
Traditionally, FCAS has been provided by generators and large electricity users. However, grid-scale batteries are increasingly taking on this role due to their rapid response times, flexibility, and precision at either charging or discharging as required. Recognising the need for faster response times to manage frequency, the NEM added a new category called “Very Fast FCAS” in October 2023, which requires a response within 1 second, compared to the previous fastest category requiring a 6 second response.
One of the benefits of an interconnected NEM is the ability to procure FCAS from the cheapest providers across the network, sharing reserves and enhancing grid security at lower costs. For instance, South Australia can provide FCAS to cover a generator trip in Queensland.
However, when interconnectors become unavailable due to maintenance or outages, it can lead to states being required to procure FCAS locally, which can significantly increase costs if competition is limited. This was the case in July and August when transmission outages restricted the interconnector between South Australia and Victoria, requiring South Australia to locally procure Very Fast FCAS. Due to limited participants in South Australia, the price of this service spiked dramatically. Over the weekend of the 16th and 17th of August, prices for the Very Fast FCAS exceeded $19,000/MWh for 90 trading intervals. The average price of this service rose from $0.34 in June to $182.28 in July and $439.51 in August.
Market price protections in the NEM
The NEM has two key mechanisms to protect against high prices:
- Market Price Cap (MPC): The maximum allowed spot price in a 5-minute interval, which increased from $17,500/MWh to $20,300/MWh on July 1st.
- Cumulative Price Threshold (CPT): Limits the maximum price over a rolling 7-day period, equivalent to roughly 7 hours of prices at the MPC. If breached, prices are temporarily capped at $600/MWh.
Because the high FCAS prices were due to a local constraint, South Australian consumers will bear the cost through increased ancillary service charges. This event underscores the value of interconnection. The completion of Project Energy Connect – a new transmission link between South Australia and New South Wales and expected in late 2027 will help reduce local FCAS costs in the future. The continued roll out of grid-scale batteries will also increase competition and resilience in the FCAS market.
Coal generator availability remains a concern
Unplanned outages continued to impact coal generators in August, with all four black coal generators in New South Wales and two of Victoria’s three brown coal generators experiencing unit outages. With winter behind us, we now enter the spring shoulder period, during which planned maintenance outages are scheduled. From mid-September to mid-November, at least one unit at three New South Wales coal generators is expected to be offline, with two of the outages extending into December. This will leave the system vulnerable to any additional unplanned outages, particularly with major transmission maintenance scheduled over the same period.
Transmission maintenance risks in New South Wales
New South Wales and Queensland experienced significant price volatility in late 2024 due to transmission maintenance outages in southern NSW, which restricted transfer of generation from Victoria and southern NSW through to Sydney. These outages coincided with coal unit outages, exacerbating the tight supply situation.
Similar transmission outages are scheduled over the next four months, beginning with a short interruption mid-September, followed by extended outages from late September through October. These outages elevate the risk of high spot prices during evening peaks, particularly if further outages occur or demand spike unexpectedly.
For customers exposed to spot prices, such as those on Flow Power’s plans, shifting or reducing demand in response to high prices can deliver significant savings while helping to maintain system stability during critical maintenance periods.
Spring outlook
Outside of New South Wales, spring is expected to bring milder weather which will reduce demand and allow lower-cost renewable energy to displace higher cost sources. As a result, negative price intervals are likely to increase, particularly during daytime solar hours and sunny days.
According to the Bureau of Meteorology, the next three months are likely to be wetter than average across the NEM, which may reduce solar generation due to increased cloud cover. Nevertheless, minimum temperatures are forecast to be above average, further softening electricity demand.
Changes in forward contract prices for CY27
Forward contract prices for 12-month futures in NEM regions remained largely unchanged through August. End-of-month prices across all mainland NEM regions deviated by less than 2% compared to end-July levels, indicating limited movement in longer-term market sentiment.
August 2025 NEM insights by state
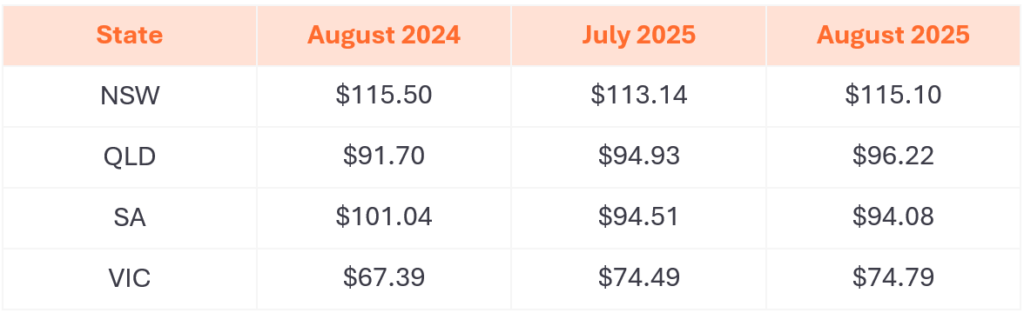
- New South Wales prices are down less than 1% from a year ago, and up 2% from July 2025
- Queensland prices are up 5% from a year ago, and 1% from July 2025
- South Australia prices are down 7% from a year ago, and less than 1% from July 2025
- Victoria prices are up 11% from a year ago, and less than 1% from July 2025
New South Wales
- Average spot price of $101/MWh, with 77 hours of negative prices and 13 hours above $300/MWh
- $200/MWh difference in average underlying spot prices at the cheapest and most expensive times of day
- No daily intervals with an average negative price over the whole month
- 33% total renewable generation through the month
- Minimum demand of 4,931 MW
- Peak demand of 12,915 MW
Queensland
- Average spot price of $78/MWh, with 188 hours of negative prices and 3 hours above $300/MWh
- $200/MWh difference between the average underlying prices at the cheapest and most expensive times of day
- Average spot price was negative or very close to zero between 9:54 AM and 2:00 PM
- 32% total renewable generation through the month
- New operational minimum demand record of 3,475 MW
- Peak demand of 8,488 MW
South Australia
- Average spot price of $87/MWh, with 186 hours of negative prices and 10 hours above $300/MWh
- $185/MWh difference between the average underlying prices at the cheapest and most expensive times of the day
- No daily intervals with an average negative price over the whole month
- 75% total renewable generation through the month
- Minimum demand of 289 MW
- Peak demand of 2,484 MW
Tasmania
- Average spot price of $125/MWh, with no hours of negative prices and less than 7 hours above $300/MWh
- $70/MWh difference between lowest and highest time-based average underlying spot price
- No daily intervals with an average negative price over the whole month
- 91% total renewable generation through the month
- Minimum demand of 833 MW
- Peak demand of 1,603 MW
Victoria
- Average spot price of $93/MWh, with 107 hours of negative prices and 12 hours above $300/MWh
- $185/MWh difference between lowest and highest time-based average underlying spot price
- Almost no daily intervals with an average negative price over the whole month
- 41% total renewable generation through the month
- Minimum demand of 2,696 MW
- Peak demand of 8,365 MW
Any questions? Our energy specialists are here to help.
If you’re an existing Flow Power customer, don’t hesitate to reach out to your account manager.
If you’re not a Flow Power customer, feel free to contact our friendly team:
1300 08 06 08