





Prices settle after July’s volatility
August was a much calmer month across the NEM, with average spot prices falling in every region. NSW remained the highest-priced region at $75.71/MWh, while Tasmania recorded the lowest average at $57.96/MWh. South Australia saw the largest month-on-month fall, declining around 25% from July to $71.62/MWh.
The most significant shift was the sharp reduction in high-price volatility. Across all regions, 5-minute price observations above $300/MWh fell from 563 in July to just 20 in August, and no region recorded a price above $500/MWh. Negative pricing remained common, but August avoided the scarcity conditions that drove several extreme outcomes in June and July.
Wind and network conditions still shaped pricing outcomes
Wind generation remained a key driver of regional prices. South Australian wind output reached 2,274 MW on 10 August, followed by 4,535 MW in Victoria on 12 August. Strong wind conditions through the middle of the month contributed to lower prices and frequent negative-price periods across the southern NEM.
Network conditions at times amplified those movements. South Australian prices fell to -$496.77/MWh on 19 August amid high wind output and constrained VIC-SA transfers. Conditions then reversed over 23–29 August as wind output eased. Victoria’s weekly average price rose from $40.34/MWh to $77.51/MWh despite lower demand, with reduced wind increasing reliance on higher-priced gas generation during the evening peak.
Daytime demand continues to weaken
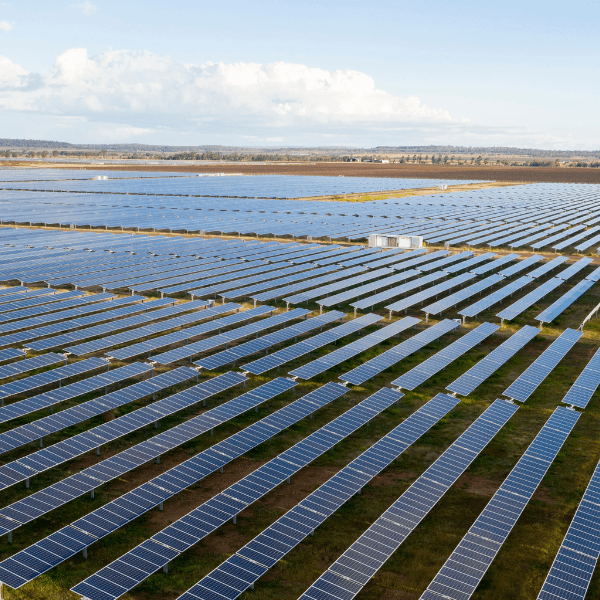
The growing impact of rooftop solar was particularly clear on 30 August, when South Australian operational demand fell to just 2 MW, setting a new winter minimum. At that point, rooftop solar was meeting 99.9% of the state’s underlying electricity demand.
Mild temperatures and clear skies also pushed NEM-wide winter minimum operational demand to a new record of 11,992 MW. For C&I participants, the continued decline in daytime operational demand reinforces the importance of managing midday load, exposure to negative pricing, and the growing value of flexibility as solar penetration rises.
ASX forward market
Late-August forward prices remained stronger than the relatively soft physical market. On 28 August, Cal-27 base futures were approximately $84.91/MWh in NSW, $75.55/MWh in Queensland, $63.17/MWh in Victoria and $78.21/MWh in South Australia.
Cal-27 prices remained above August’s provisional spot settlement averages across all four mainland regions. Nearer-term Q3 pricing was more mixed, closing at $73.67/MWh in NSW, $61.50/MWh in Queensland, $57.50/MWh in Victoria and $71.85/MWh in SA. The late-August curve continued to price a higher long-term value than the comparatively subdued spot conditions experienced during the month.
August 2026 NEM insights by state
New South Wales
- Average spot price of $75.71/MWh, with approximately 17.3 hours of negative pricing and one 5-minute interval above $300/MWh.
- $76.35/MWh difference between the cheapest and most expensive average 30-minute times of day.
- Cheapest average period was 15:00 at $34.45/MWh, while the most expensive was 17:30 at $110.80/MWh.
- Average renewable share of 33.4%.
- Minimum demand of 4,088 MW.
- Peak demand of 11,652 MW, reached at 18:00 on 10 August.
- NSW remained the highest-priced region, although its average price fell around 7% from July.
Queensland
- Average spot price of $60.42/MWh, with approximately 86 hours of negative pricing and no 5-minute intervals above $300/MWh.
- Queensland recorded the largest average intraday spread at $92.91/MWh.
- Cheapest average period was 10:30 at $10.22/MWh, while the most expensive was 17:30 at $103.13/MWh.
- Average renewable share of 31.7%.
- Minimum demand of 3,314 MW.
- Peak demand of 8,072 MW.
- Increasing solar and rooftop PV output continued to place downward pressure on daytime prices as spring approached.
South Australia
- Average spot price of $71.62/MWh, around 25% lower than July.
- Approximately 103.3 hours of negative pricing and eight 5-minute intervals above $300/MWh.
- $77.67/MWh difference between the cheapest and most expensive average 30-minute times of day.
- Cheapest average period was 12:00 at $34.69/MWh, while the most expensive was 18:30 at $112.37/MWh.
- Average renewable share of 64.8%.
- AEMO operational demand fell to 2 MW on 30 August, setting a new winter minimum.
- Peak demand reached approximately 2,387 MW during the month.
- SA recorded the largest month-on-month reduction in average price, although wind and interconnector conditions continued to produce volatility in both directions.
Tasmania
- Average spot price of $57.96/MWh, with approximately 57.5 hours of negative pricing and five 5-minute intervals above $300/MWh.
- $67.34/MWh difference between the cheapest and most expensive average 30-minute times of day.
- Cheapest average period was 14:30 at $26.21/MWh, while the most expensive was 17:30 at $93.55/MWh.
- Average renewable share of 87.0%.
- Minimum demand of 734 MW.
- Peak demand of 1,444 MW.
- Tasmania was the lowest-priced NEM region and continued to track Victorian pricing more closely following Basslink’s transition to regulated operation.
Victoria
- Average spot price of $60.40/MWh, around 14% lower than July.
- Approximately 80.4 hours of negative pricing and six 5-minute intervals above $300/MWh.
- $76.76/MWh difference between the cheapest and most expensive average 30-minute times of day.
- Cheapest average period was 14:00 at $24.35/MWh, while the most expensive was 17:30 at $101.11/MWh.
- Average renewable share of 39.6%.
- Minimum demand of 2,839 MW.
- Peak demand of 8,508 MW.
- Strong wind contributed to softer prices through the middle of August before lower wind lifted evening prices later in the month.
Any questions? Our energy specialists are here to help.
If you’re an existing Flow Power customer, please reach out to your account manager.
For all other enquiries, get in touch with our friendly team:
1300 08 06 08