




Australia experienced an unseasonably warm and wetter-than-average June, marked by record-breaking winter heat in the east and national rainfall 27% above the historical average according to the Bureau of Meteorology.
Milder conditions and a drop in wind generation saw South Australia’s most significant price event of June begin on the evening of Sunday 21 June and continue into the Monday morning peak.
The first major spike occurred at 7:35pm, after wind generation had fallen to negligible levels and winter demand remained elevated. Four five-minute intervals exceeded $10,000/MWh on Sunday evening. Prices stayed unusually high overnight, rarely falling below $300/MWh, before reaching the $20,300/MWh market price cap for ten intervals on Monday morning.
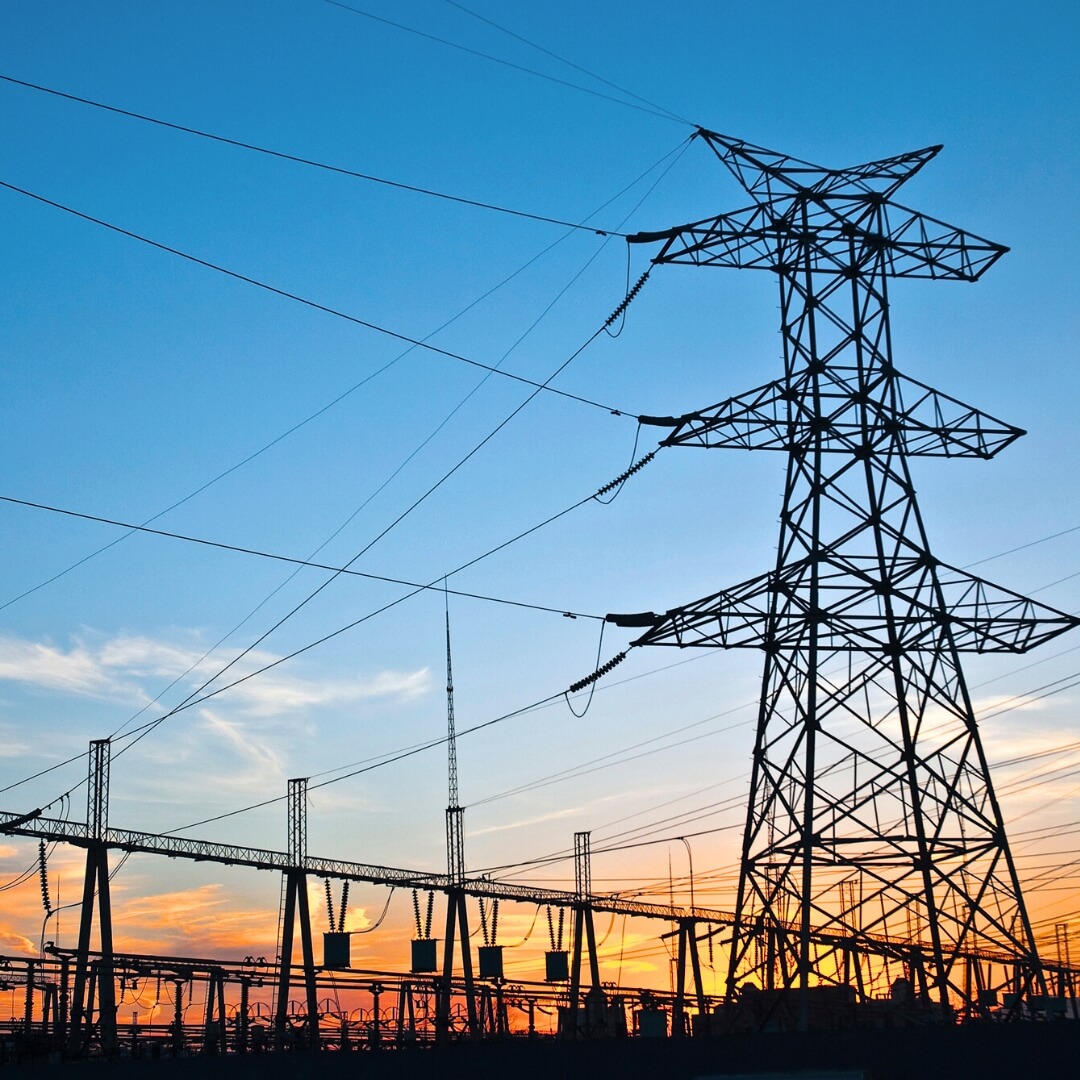
Although the weather conditions were a contributing factor, the event was not caused by low wind alone. A short-notice reduction in the rating of the Buronga to Balranald X3 transmission line limited the amount of electricity that could be transferred into South Australia through Murraylink and the new Project EnergyConnect corridor.
At several critical points, the market dispatch process was required to reduce or reverse imports to protect the line, resulting in South Australia exporting electricity even while local prices were in the thousands of dollars per megawatt hour.
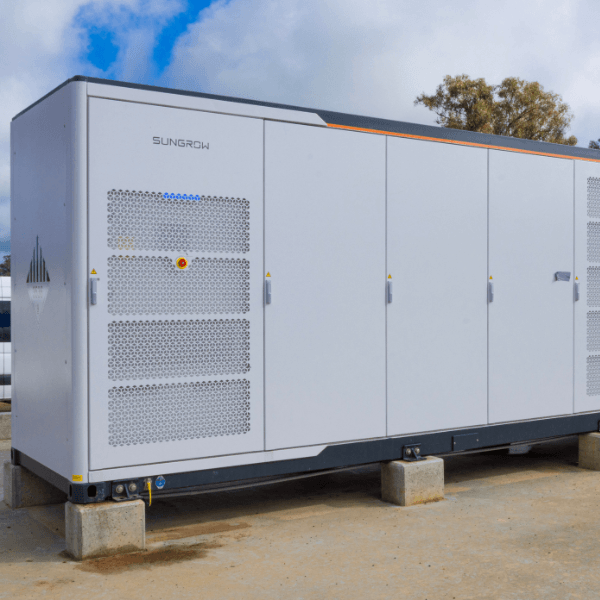
Batteries provided substantial support during the earlier evening peaks, but the fleet entered Monday morning with very little stored energy after failing to recharge completely overnight. This left the region increasingly reliant on gas and diesel generation during the morning price event, driving prices much higher than usual. The X3 line was subsequently taken out of service at around 8:00am on 22 June.
Record-low wind conditions
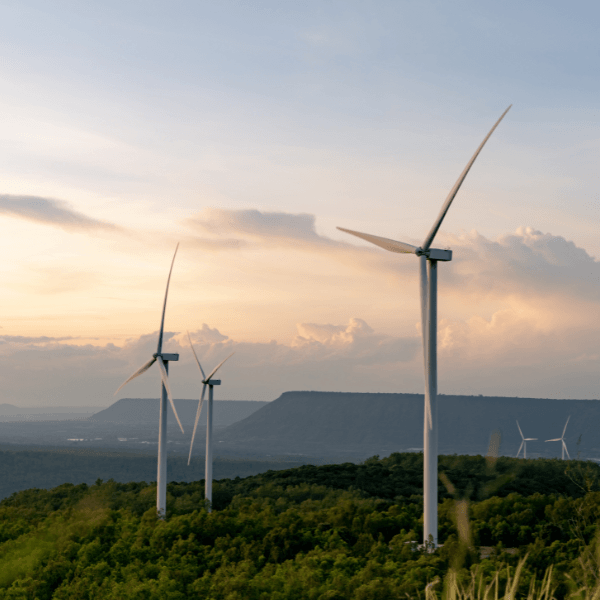
The price event occurred during South Australia’s worst four-day wind lull since 2019. Average wind output over the four days to 24 June fell to just 124 MW, equivalent to around 4.5% of the state’s 2,734 MW of installed wind capacity. Wind generation remained below 10% of installed capacity for more than four days and fell to approximately 10 MW at times.
The low output reflected a genuine shortage of wind resource rather than widespread network curtailment or generators choosing not to produce. The four-day average was lower than comparable wind droughts in June 2019 and May 2024, despite South Australia having substantially more installed wind capacity than it did in 2019.
Wind generation as a share of local consumption also fell to its lowest level in around eight years. Gas-fired generation supplied much of the shortfall and there was no load shedding, but the event demonstrated the challenge of relying mainly on short-duration batteries during a renewable lull lasting several days.
June still set a wind generation record
The wind drought represented only a short portion of an otherwise very strong month for South Australian wind generation.
Wind farms produced approximately 730 GWh during June, the highest total recorded for the month of June in South Australia. Before the lull, strong wind conditions had supplied more than 100% of the state’s local electricity demand on average for more than three consecutive days, allowing South Australia to export surplus renewable energy and sharply reduce gas generation.
Wind output also recovered strongly after the lull. This meant the exceptionally weak period was more than offset by high production during the rest of the month. The contrast is important: South Australia recorded both its weakest four-day wind conditions since at least 2019 and its highest-ever June wind generation total within the same month.
Monthly renewable generation figures can therefore conceal shorter periods of scarcity that have a disproportionate effect on spot prices. The event reinforces the value of longer-duration storage, stronger interconnection and sufficient flexible generation to cover periods when low wind persists beyond the discharge duration of the existing battery fleet.
Forward market responds selectively to late-June volatility
The ASX forward market showed a split response during June. Near-term South Australian pricing reacted sharply to the extreme spot events of 21–22 June, with the Q2 2026 base contract rising from around $73.50/MWh in mid-June to approximately $89/MWh by 24–25 June as the quarter-to-date spot average increased rapidly.
This indicates that the market did recognise the immediate financial impact of the wind drought, elevated demand and restricted imports from Victoria.
However, the repricing remained concentrated in prompt South Australian contracts rather than extending across the broader forward curve. New South Wales, Queensland and Victorian contracts softened through much of June before recovering modestly late in the month, while Cal-27 prices reached new lows across all regions.
This suggests participants viewed the South Australian event primarily as a short-term combination of exceptionally low wind, transmission constraints and winter demand, rather than evidence of a lasting structural deterioration in NEM supply conditions.
June 2026 NEM insights by state
New South Wales
- Average spot price of $83.08/MWh, with approximately 2.6 hours of negative prices and no prices above $300/MWh
- $55.15/MWh difference in average 30-minute spot prices at the cheapest and most expensive times of day
- No 30-minute time-of-day average was negative across the month
- 31.4% total renewable generation through the month
- Minimum demand of 5,580 MW
- Peak demand of 11,317 MW
Queensland
- Average spot price of $71.32/MWh, with approximately 16 hours of negative prices and no prices above $300/MWh
- $78.69/MWh difference in average 30-minute spot prices at the cheapest and most expensive times of day
- No 30-minute time-of-day average was negative across the month
- 30.0% total renewable generation through the month
- Minimum demand of 3,580 MW
- Peak demand of 8,120 MW
South Australia
- Average spot price of $125.34/MWh, with approximately 140 hours of negative prices and 44.1 hours above $300/MWh
- $705.10/MWh difference in average 30-minute spot prices at the cheapest and most expensive times of day
- The most expensive average time of day was 7:30 AM, averaging $771.48/MWh, reflecting the extreme price events on 21–22 June
- No 30-minute time-of-day average was negative across the month
- 66.0% total renewable generation through the month
- Minimum demand of 556 MW
- Peak demand of 2,397 MW
Tasmania
- Average spot price of $76.84/MWh, with approximately 3.2 hours of negative prices and 30 minutes above $300/MWh
- $141.52/MWh difference in average 30-minute spot prices at the cheapest and most expensive times of day
- No 30-minute time-of-day average was negative across the month
- 96.8% total renewable generation through the month
- Minimum demand of 733 MW
- Peak demand of 1,576 MW
Victoria
- Average spot price of $66.41/MWh, with approximately 118 hours of negative prices and 2.1 hours above $300/MWh
- $65.27/MWh difference in average 30-minute spot prices at the cheapest and most expensive times of day
- No 30-minute time-of-day average was negative across the month
- 37.5% total renewable generation through the month
- Minimum demand of 3,870 MW
- Peak demand of 8,332 MW
Any questions? Our energy specialists are here to help.
If you’re an existing Flow Power customer, please reach out to your account manager.
For all other enquiries, get in touch with our friendly team:
1300 08 06 08