


Increase in spot prices
Average spot prices across the National Energy Market (NEM) have risen in April. The low cap payout (which showed that there were not many prices above $300/MWh) shows that much of this rise was not caused by price volatility (where prices spike to extremely high prices for shorter periods of time). Rather, it was due to generally higher than typical prices throughout all times of the day.
Interestingly, the increase in spot prices between March and April goes against what would normally be expected, especially after we factor in reduced demand throughout the day in April 2022.
Generator behaviour across the NEM
However, things start to become a little clearer when examining generator availability across each region, as various outages resulted in lower availability in all mainland regions during the month.
In addition, large generators across the NEM shifted volumes of their generation into higher priced bands. The combination of lower availability and more generation being offered at higher prices has resulted in higher spot prices across the NEM.
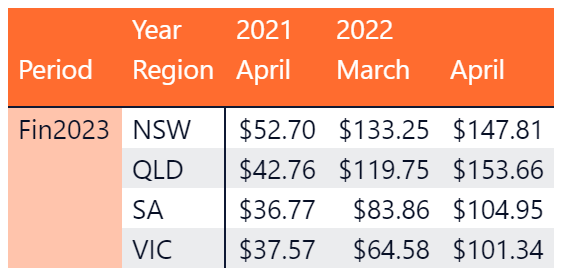
The trend of increasing forward prices for FY 2023 has continued, with prices in all mainland regions exceeding $100/MWh, and New South Wales and Queensland at around $150/MWh:
- New South Wales is up 153% from a year ago, and 11% from February 2022
- Queensland is up 180% from a year ago, and 28% from February 2022
- South Australia is up 128% from a year ago, and 25% from February 2022
- Victoria is up 72% from a year ago, and 57% from February 2022
April 2022 NEM insights – by state
Click on our dynamic graph below to view the figures for your state:
To navigate to a particular past month, select page 2 on the bottom of the graph, and then use the drop down menu to make a selection.
New South Wales April 2022
- Average spot price of $186.84/MWh, with 3 hours of negative prices
- $180/MWh difference in average spot prices at the cheapest (mid-morning) and most expensive (evening peak) times
- With one unit of Liddell closing on April 1, the availability through April was lower than that of March 2022 – however while the closed Liddell unit had a capacity of 500MW, availability throughout the month was lower by around 1000MW, indicating other outages having an impact
- Similar demand curve to April 2021, and lower morning/afternoon demand when compared to March 2022
Queensland April 2022
- Average spot price of $147.20/MWh, due to several exceptionally high price intervals on the 8th of March. Excluding these prices, the average underlying spot price was $102.90/MWh
- Average spot price of $219.74/MWh, with 4 hours of negative prices
- $200/MWh difference between the average prices at the cheapest and most expensive times of day
- Similar demand when compared to April 2021, and lower compared to March 2022
- Lower availability when compared to March 2022 – like NSW, this decrease in availability was a bigger drop than the decrease in demand, resulting in tighter supply/demand interactions
South Australia April 2022
- Average spot price of $152.34/MWh, with 84 hours of negative prices
- $200/MWh difference between the average price at around noon (with higher solar) and the average evening peak price
- Similar demand to April 2021 and March 2022
- Lower rooftop solar generation compared to March 2022
Victoria April 2022
- Average spot price of $141.49/MWh, with 52 hours of negative prices
- $180/MWh difference between lowest and highest time-based average spot price
- Lower demand when compared to April 2021 and March 2022
- Slightly higher off-peak availability compared to April 2021, but much lower (~700MW) when compared to March 2022
- While year on year solar generation increased, April saw a decrease in average rooftop solar generation when compared to March 2022
Spot, negative and wholesale prices wrap up
Bucking the trend, the total hours of negative prices across the NEM in April are around half of those in March 2022, and similarly half of those in April 2021. Conversely, the NEM-wide hours at or above the cap payout level ($300/MWh) have ballooned in April, with more than 130 hours of prices >=$300/MWh – this is more than any month in our analysis, which looked at all months starting in January 2014. Most of these hours were in Queensland, with South Australia having the next highest total.
Just as the duck curve (the difference between off peak and peak pricing) effect continues to grow, we can see a similar trend with wholesale pricing. Meaning, the growing gap between i the lowest and highest average prices at different points of the day is increasing.
While spot prices are certainly higher this month, it is becoming important (especially for wholesale or power active customers) to understand that average prices vary throughout the day and to try and adjust their power use accordingly.
An increase in underlying electricity prices
In April, there was some price volatility (i.e., prices spiking to very high levels) throughout the month. This tended to happen in the evening, just as solar generation tapered off and evening demand picked up.
While previous months with high average spot prices could be attributed to a number of these price volatility events, April was different. The high underlying spot prices in April were caused by a general uplift in underlying prices as opposed to price volatility.
Despite many generators having long term coal sourcing contracts, globally higher prices of coal are impacting local power prices – often when a generator needs to supply additional coal to supplement their supplies, they turn to the coal spot market. This then raises the operating costs of thermal generation, and the resulting price premium can be seen when examining the shifting bid volumes of thermal generation to higher priced segments.
Looking ahead to May 2022
As we head into winter, we will see a decrease in solar generation and an increase in load from electric heating. This could result in tighter supply/demand conditions, and higher spot prices may follow.
Historically, the NEM tended to have higher prices in hotter months, due mostly to increased electricity demand due to air-conditioning. However, the mass uptake of rooftop solar (which is typically most productive over summer) and the increase in heating demand as customers switch away from gas heating may change this dynamic, shifting the NEM into a “winter-peaking” system. This could mean increased wholesale prices and price volatility occurring more in the winter months as opposed to summer months.
Last winter saw the direct fallout of Callide Power Station’s explosion lingering throughout, which reduced supply amidst this increased seasonal demand and resulted in high frequency price volatility. While the market has settled since then, we’ll be watching to see how the prices in the winter compare to the summer.
How weather could impact the energy market
For May, the Bureau of Meteorology (BOM) is predicting:
- Higher daily minimums and maximums along the south-east and east coasts
- Balmy winter weather that may reduce heating demand
.
Similar to April, BOM is also predicting higher than average rainfall across all regions, which may affect both grid-scale and rooftop solar output.
Any questions? Our energy specialists are here to help.
If you’re an existing Flow Power customer, please do not hesitate to reach out to your account manager.
If you’re not a Flow Power customer, feel free to contact our friendly team:
? 1300 08 06 08
Alternatively, you can submit your questions through our website contact form here.