


April, positioned in the shoulder season of autumn, typically sees lower electricity consumption due to milder weather conditions—and April 2025 followed this historical pattern.
Warmer-than-average daytime temperatures coupled with cool, but not extreme, overnight lows kept operational demand (the electricity required from large-scale generators, excluding rooftop solar) subdued throughout the month. Without major cold fronts or sharp temperature drops, there were a few heating-driven demand peaks. This led to consistently low demand, particularly during daylight hours when rooftop solar significantly offset grid demand.
Around the Easter and Anzac Day holiday period, net demand during several midday intervals dropped to very low levels, prompting some coal generators to reduce output or temporarily shut down.
Electricity price insights
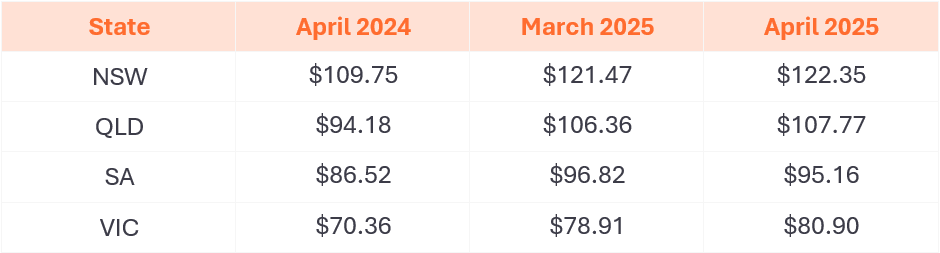
In April, average spot prices increased across all National Electricity Market (NEM) regions compared to March, though underlying drivers varied across the states. In New South Wales and Queensland, electricity demand was lower than in February and March. Despite this, an unplanned outage at Callide Power Station early in the month reduced availability of generation across the two states, pushing up wholesale electricity prices. In contrast, demand in Victoria and South Australia remained steady, however renewable generation was lower than in previous months, which contributed to higher wholesale prices. In Tasmania, ongoing below-average rainfall continued to put pressure on hydro generation, further challenging supply conditions.
Renewables accounted for 39.9% of all electricity generated across the NEM in April, compared to 40.4% in March and 35.8% in April 2024.
Flexibility in the supply mix
The month highlighted the increasing flexibility of the NEM’s supply mix. Several coal generator units reduced or halted operations during low-demand, negative-price periods to avoid losses, while battery storage systems played a critical role in price management. Batteries charged during periods of excess solar generation and discharged during peak evening demand. In April, the NEM’s battery fleet set a new monthly dispatch record, discharging approximately 95 GWh—almost double the total battery discharge of 48 GWh in April 2024.
Outages
On 4 April, a significant unplanned outage occurred at Callide Power Station in Queensland when unit C3, a 424 MW coal unit, tripped off. CS Energy attributed the incident to a boiler failure and has confirmed the unit will remain offline for repairs until at least May 30. This outage contributed to tighter supply in Queensland and New South Wales, driving higher late-afternoon prices in early April.
At the time of writing, 8 of the 34 large coal units across Queensland and New South Wales are offline, including half of the coal stations in New South Wales. Due to its milder weather, the shoulder season is typically used for maintenance, however, the unplanned outages have caused tighter market conditions in the northern states.
The combination of reduced coal capacity, variable renewable supply and the potential for sudden network constraints means the risk of price volatility, particularly in the evening, remains high. Customers on wholesale-linked plans, such as Flow Power’s, have the potential to achieve significant savings if they can shift consumption away from these high price periods.
Changes in forward contract prices for FY26
Forward prices for 12-month futures in NEM regions saw modest increases throughout March.
- New South Wales prices are up 11% from a year ago, and 1% from March 2025
- Queensland prices are up 14% from a year ago, and 1% from March 2025
- South Australia prices are up 10% from a year ago, and down 2% from March 2025
- Victoria prices are up 15% from a year ago, and 3% from March 2025
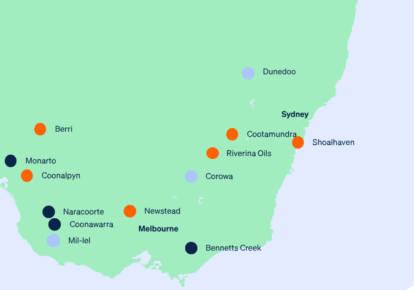
April 2025 NEM insights by state
New South Wales
- Average spot price of $104/MWh, with 86 hours of negative prices and 5 hours above $300/MWh
- $220/MWh difference in average underlying spot prices at the cheapest and most expensive times of day
- No daily intervals with an average negative price over the whole month
- 37% total renewable generation through the month
- Minimum demand of 4,171 MW
- Peak demand of 9,737 MW
Queensland
- Average spot price of $98/MWh, with 122 hours of negative prices and 5 hours above $300/MWh
- $230/MWh difference between the average underlying prices at the cheapest and most expensive times of day
- Average prices were close to 0 or negative for all periods between 9:00 AM and 1:00 PM during the month
- 31% total renewable generation through the month
- Minimum demand of 4,240 MW
- Peak demand of 8,514 MW
South Australia
- Average spot price of $89/MWh, with 136 hours of negative prices and 4 hours above $300/MWh
- $180/MWh difference between the average underlying prices at the cheapest and most expensive times of the day
- Average prices were close to 0 or negative for all periods between 12:30 AM and 2:00 PM during the month
- 74% total renewable generation through the month
- Minimum demand of 209 MW
- Peak demand of 2,227 MW
Tasmania
- Average spot price of $101/MWh, with less than 1 hour of negative prices and 1 hour above $300/MWh
- $100/MWh difference between lowest and highest time-based average underlying spot price
- No daily intervals with an average negative price over the whole month
- 99% total renewable generation through the month
- Minimum record of 846 MW
- Peak demand of 1,444 MW
Victoria
- Average spot price of $75/MWh, with 127 hours of negative prices and 1 hour above $300/MWh
- $170/MWh difference between lowest and highest time-based average underlying spot price
- Average prices were close to 0 or negative for all periods between 11:00 AM and 2:30 PM during the month
- 37% total renewable generation through the month
- New minimum demand record of 2,338 MW
- Peak demand of 6,602 MW
Looking ahead to May 2025
Seasonal factors tend to make Q2 one of the more volatile periods in the NEM in recent years. As we move closer to winter, average spot prices are expected to rise. May is part of the “shoulder season” – a transitional period between summer and winter where conditions swing rapidly. For example, a sudden cold snap may coincide with generators offline for maintenance.
The prices for Q2 2025 (April–June) Electricity Futures have fallen in all regions from the prices they were being traded at in late-2024 levels, indicating market expectations for lower spot prices for the rest of the quarter. This is largely due to a milder weather outlook and increased renewable generation, both of which are expected to suppress average prices. However, price volatility remains a real possibility. The trend of a “two-speed” market is likely to continue – characterized by low or negative prices during sunny midday hours, when solar generation remains strong despite shorter days and sharp price spikes during the evening peak, especially when wind generation is low.
The past two winters (2023 and 2024) were Australia’s warmest on record, and according to the Bureau of Meteorology’s latest climate outlook, this winter is expected to be exceptionally warm across Australia, and potentially one of the warmest winters on record. For May specifically, above-average temperatures are highly likely across all NEM regions. These warmer-than-normal conditions should limit the number of cold mornings and nights, thereby reducing demand for heating. In practical terms, milder nights are expected to moderate evening peak loads, which could alleviate pressure on the system during peak times.
Any questions? Our energy specialists are here to help.
If you’re an existing Flow Power customer, don’t hesitate to reach out to your account manager.
If you’re not a Flow Power customer, feel free to contact our friendly team:
1300 08 06 08