


Electricity prices ease after June volatility
Electricity prices across Queensland, New South Wales, and Victoria returned to typical levels in July, following significant volatility in June. The average wholesale price in Queensland halved compared to June, while New South Wales and Victoria recorded 62% and 70% declines respectively. Although coal generator availability remained a challenge through the first half of July, strong wind generation helped bridged the gap and helped to prevent a repeat of the extreme evening peak spot prices seen in June. For example, in Victoria, wholesale prices above $300/MWh contributed just $0.17 to the monthly average in July, compared to $129.67 in June.
Volatility in South Australia
South Australia was the outlier state in July. South Australia experienced a significant high price event on July 2nd, with more than 6 hours of elevated pricing. Morning peak prices averaged over $3,000/MWh for an hour, and evening peak prices exceeded $6,000/MWh for five and a half hours. This extreme volatility was primarily driven by transmission maintenance which limited flow on the interconnector from Victoria, combined with cold and still weather conditions. This single day contributed 40% of the monthly average price and resulted in South Australia recording the highest price in the National Electricity Market (NEM) for July – double that of Victoria.
The Heywood interconnector, which connects South Australia and Victoria, plays a critical role in balancing supply and demand in South Australia. With capacity capable of supplying up to 25% of South Australia’s typical winter peak demand, the link helps to displace expensive gas or diesel peaking generation and facilitates the export of excess renewable energy between the two states.
Throughout July and into mid-August, transmission maintenance significantly reduced the interconnector’s allowable flow, operating at just 10–50% of normal capacity. On July 2, this coincided with extremely low wind output (output was less than 2% of total rated capacity) and a cold snap that drove up demand. While battery storage helped meet around 10% of peak demand, the state had to rely heavily on costly diesel-fired generation. Since diesel units typically only operate in rare, high-demand situations, they require elevated prices to recover their fixed and variable costs.
Fortunately, wind generation was more consistent throughout the remainder of the maintenance period, helping to avoid a repeat of the extreme price conditions experienced on July 2.
Tasmania and the changing role of Basslink
Tasmania recorded the second highest wholesale prices in the NEM in July. Persistently dry conditions combined with a change in the operation of the Basslink interconnector from 1 July led to reduced average flows from Victoria and increased price separation between Tasmania and the mainland.
Basslink, the High Voltage Direct Current (HVDC) interconnector between Tasmania and Victoria, is an important piece of transmission infrastructure that helps manage supply and demand in Tasmania, particularly given the state’s reliance on hydroelectricity. Under a longstanding agreement with Hydro Tasmania, the link typically flowed in the direction of higher prices, often helping Tasmania manage dry spells. However, that agreement ended on 1 July 2025 ahead of Basslink transitioning to a regulated transmission service on 1 July 2026.
Without the long-term agreement with Hydro Tasmania in place, and prior to becoming a regulated asset, Basslink has taken a more active role in the Tasmania and Victorian electricity markets. Basslink earns revenue by ‘buying’ power from one state and ‘selling’ it to a higher price state – also known as arbitraging. This means that Basslink is more likely to hold back capacity so power flows when there is greater price separation between Victoria and Tasmania.
Given Tasmania’s ongoing dry conditions, average monthly power flows have been from Victoria to Tasmania every month since September 2024. With the change in Basslink operation, these flows now occur less frequently and only when price differences justify them. This has led to higher average prices in Tasmania and lower average flows across the Basslink interconnector.
The Tamar Valley gas generator in Tasmania returned to service in the second week of August for the first time since August 2024. Unless Tasmania receives significant rainfall or Basslink resumes operating under less constrained conditions, upward pressure on Tasmanian prices is likely to persist.
Generator availability remains a concern
Unplanned outages of coal generation units were a key driver of price volatility in June, with four units (18% of total capacity) offline across New South Wales and Victoria during the evening of June 26. In early July, three coal units remained unavailable due to unplanned outages. Availability improved in the second half of the month, with all units in New South Wales and Victoria returning to service by the final week.
However, this improved availability proved to be short-lived. By the second week of August, a unit in each state has once again gone offline for unplanned maintenance. These unplanned outages continue to present risks, particularly when they coincide with planned transmission maintenance, as was the case during the price spikes in November and December 2024. With spring offering a crucial window for long-duration maintenance on both generation and transmission assets, the reliability of remaining fleet, especially in New South Wales, will be a key factor influencing price outcomes in the coming months. Even a single additional outage can put significant stress on the market and elevate prices.
Spring outlook
Southern Australia (including the Snowy region in New South Wales) typically experiences its peak rainfall season during winter and spring, with the heaviest inflows usually occurring from June to September. So far this winter, rainfall has been below average, and key hydro catchments in the Snowy mountains and Tasmania are currently tracking below the typical historical storage levels.
The Bureau of Meteorology (BoM) climate outlook predicts a greater than average likelihood of above median rainfall for the eastern half of the Australian mainland for the remainder of 2025. This may extend as far south as Tasmania, although with less certainty. Any additional rainfall could help replenish hydroelectric storage, though increased cloud cover may also reduce solar generation due to lower irradiance.
The BoM also predicts a higher-than-average likelihood of above median maximum temperatures across most of Australia, with the exception of coastal New South Wales. Tasmania, Victoria, and Northern Queensland are expected to experience the greatest increases compared to median temperatures. Minimum temperatures are also forecast to be well above median across eastern Australia, suggesting warmer-than-usual overnight conditions from September through the end of the year.
Will winter bring any last surprises?
Historically, high demand driven by cold weather remains a risk through to mid-September. In the short-term forecast, there are no signs of extreme winter conditions across the NEM, however, beyond the current forecast window, a final blast of winter can’t be ruled out. Should such a weather event coincide with generator outages, the risk of high spot prices would increase.
As we transition to spring, the days grow longer, improving both temperatures and available solar generation. Southern Australia typically sees strong winds during spring, and the combination of mild weather, greater solar generation and increased wind output often leads to lower prices across the late August to November period.
However, spring also brings an uptick in planned generation and transmission maintenance, as asset owners take advantage of the lower risk of peak demand. Several long-duration outages of coal generation units are already scheduled to begin in September and extend into December.
If generator availability remains high, and no major late season cold snaps occur, August prices are likely to remain at or below July levels, as we enter a period of lower seasonal demand.
Changes in forward contract prices for CY27
Forward prices for 12-month electricity futures in NEM regions remained largely flat throughout July, showing little change from June.

- New South Wales prices are down 4% from a year ago, and 6% from June 2025
- Queensland prices are up 4% from a year ago, and 2% from June 2025
- South Australia prices are down 10% from a year ago, and 7% from June 2025
- Victoria prices are up 7% from a year ago, and 4% from June 2025
July 2025 NEM insights by state
New South Wales
- Average spot price of $97/MWh, with 45 hours of negative prices and 6 hours above $300/MWh
- $160/MWh difference in average underlying spot prices at the cheapest and most expensive times of day
- No daily intervals with an average negative price over the whole month
- 30% total renewable generation through the month
- Minimum demand of 6,302 MW
- Peak demand of 13,329 MW
Queensland
- Average spot price of $82/MWh, with 137 hours of negative prices and 3 hours above $300/MWh
- $200/MWh difference between the average underlying prices at the cheapest and most expensive times of day
- Average spot price was negative or very close to zero between 11:00 AM and 2:00 PM
- 32% total renewable generation through the month
- Minimum demand of 4,233 MW
- Peak demand of 8,628 MW
South Australia
- Average spot price of $165/MWh, with 188 hours of negative prices and 49 hours above $300/MWh
- $150/MWh difference between the average underlying prices at the cheapest and most expensive times of the day
- No daily intervals with an average negative price over the whole month
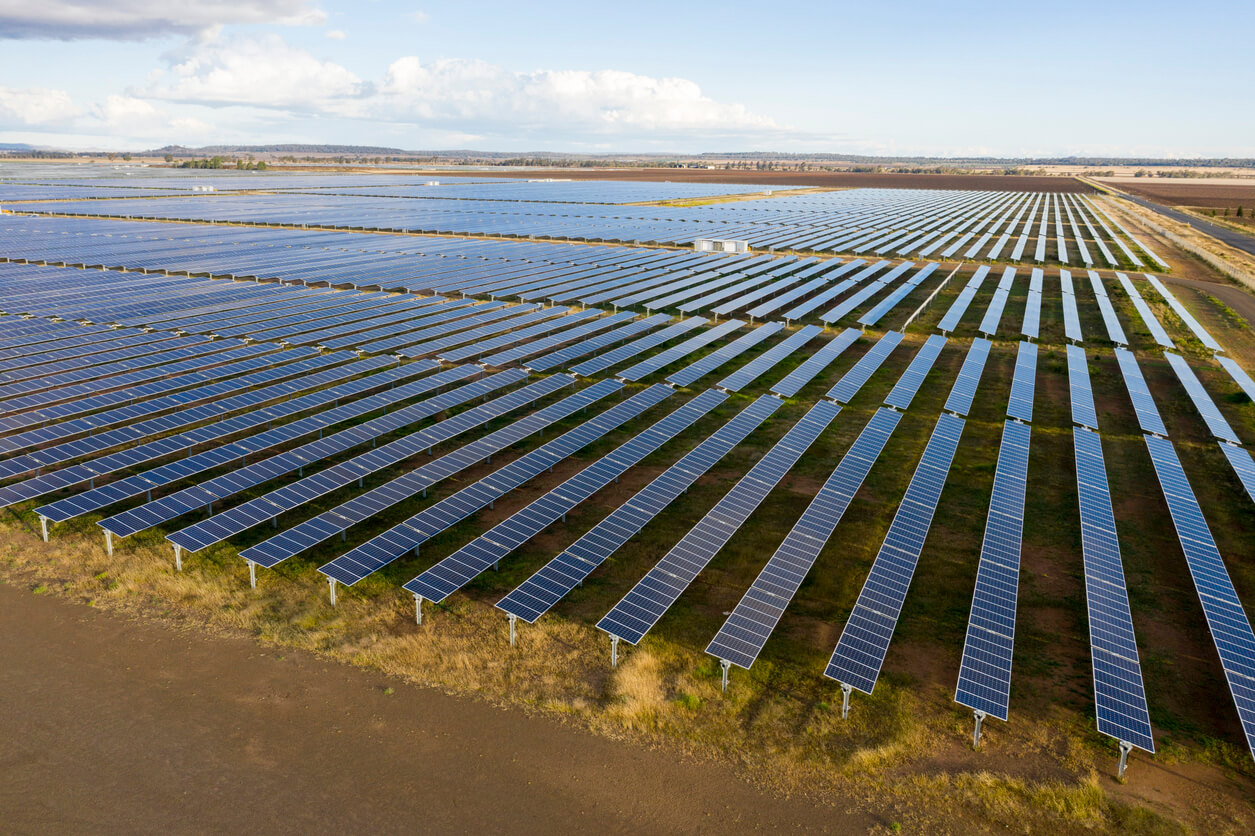
- 71% total renewable generation through the month
- Minimum demand of 621 MW
- Peak demand of 2,718 MW
Tasmania
- Average spot price of $118/MWh, with no hours of negative prices and less than 1 hour above $300/MWh
- $60/MWh difference between lowest and highest time-based average underlying spot price
- No daily intervals with an average negative price over the whole month
- 98% total renewable generation through the month
- Minimum demand of 1,002 MW
- Peak demand of 1,684 MW
Victoria
- Average spot price of $82/MWh, with 104 hours of negative prices and 4 hours above $300/MWh
- $160/MWh difference between lowest and highest time-based average underlying spot price
- No daily intervals with an average negative price over the whole month
- 40% total renewable generation through the month
- Minimum demand of 3,583 MW
- Peak demand of 8,746 MW
Any questions? Our energy specialists are here to help.
If you’re an existing Flow Power customer, don’t hesitate to reach out to your account manager.
If you’re not a Flow Power customer, feel free to contact our friendly team:
1300 08 06 08