


Average temperatures across the eastern states were above average in May, capping off a particularly warm autumn. According to the Bureau of Meteorology (BoM), autumn 2025 was the warmest on record for Victoria, the second warmest for New South Wales, and the third warmest for South Australia. Earlier in the season, the record temperatures were driven by both higher average maximums and higher average minimums. However, a shift occurred in May, particularly in the southern states (Victoria, South Australia, and Tasmania), where maximum temperatures remained above average, but minimums fell below average – resulting in warmer days but colder nights and frosty mornings.
Despite the relatively mild weather, several days of tight supply-demand conditions emerged in New South Wales during mid-May. These were driven by a combination of planned transmission maintenance, unplanned coal unit outages, and low renewable energy output during the evening peak.
Renewables contributed 38.2% of total electricity generated across the National Electricity Market (NEM) in May.
Electricity price insights
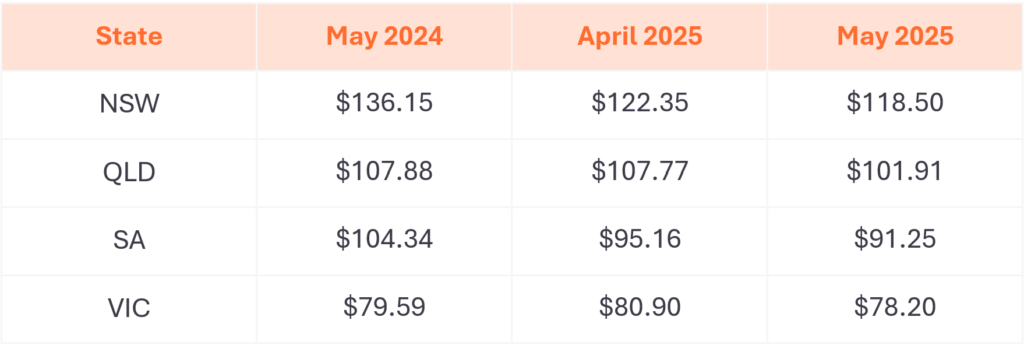
Mild conditions kept monthly average relatively flat from April to May across Queensland, Victoria, South Australia, and Tasmania. New South Wales stood out, recording the highest average prices among all states – up 18% from April.
There were five days in May where prices in New South Wales exceeded $1,000/MWh. On May 13th, prices spiked above $10,000/MWh during eight 5-minute intervals in the evening peak. These high prices were unexpected and significantly above forecasts from earlier in the day, reflecting the volatility that can arise when supply and demand become tightly balanced. Key contributors to this uncertainty included fluctuating demand forecasts, transmission constraints, generator re-bidding behavior, and variable renewable output. Generally, the high prices in New South Wales in May tended to start earlier in the evening- around 4:30pm, and concluded by 6pm – ahead of the usual demand peak
Transmission interconnectors connect the regions of the NEM together and play a major role in price dynamics. Normally, regions that are connected have similar prices because they can share power across an interconnector. On days when New South Wales experienced high prices, the interconnectors from Queensland and Victoria often reached their transfer limits, meaning no additional power could flow into New South Wales and causing prices to spike significantly above neighbouring states. Queensland also recorded prices above $1,000/MWh on two occasions, although they did not reach the same peaks as New South Wales.
Throughout the month, New South Wales prices averaged $123.02/MWh – over 50% higher than the average Victoria price of $78.05/MWh. A key factor behind the lower Victorian prices was strong wind generation at the beginning and end of the month, contributing to lower prices for the southern states. On four days in May, Victoria and South Australia recorded negative average daily prices due to this high wind output and limited flow to New South Wales.
For consumers exposed to spot prices, such as those with electricity supplied by Flow Power, these conditions present cost-saving opportunities—such as charging electric vehicles during periods of high wind generation and low prices.
Flexibility in the supply mix
The NEM continues to see a steady increase in the registration and commissioning of grid-scale batteries. At the time of writing, sixty-four grid-scale batteries have been registered, with installations spread almost evenly between Queensland, New South Wales, Victoria, and South Australia – the latter home to the first ‘big battery’ at Hornsdale and commissioned in 2017. These batteries have been growing in both in capacity (MW) and duration of storage (MWh) with a rapidly expanding pipeline of new projects set to further reshape the market in the coming years.
On more and more days, grid-scale batteries are storing a greater volume of energy than pumped hydro systems across the NEM. Batteries boast higher round-trip efficiencies, meaning a greater proportion of this stored energy can be discharged over peak periods. While total storage capacity is still smaller compared to most pumped hydro schemes, their flexibility and responsiveness make them well suited to managing daily fluctuations in renewable energy output and helping to keep the system secure during peak demand periods.
In parallel, falling costs and increased support for household batteries are enabling more homes to participate directly in the energy market. As household battery adoption scales up—mirroring the trajectory of grid-scale systems—consumers will play a growing role in shaping market dynamics.
Changes in forward contract prices for FY26
Forward prices for 12-month futures in NEM regions fell throughout April.
- New South Wales prices are down 13% from a year ago, and 3% from April 2025
- Queensland prices are down 6% from a year ago, and 5% from April 2025
- South Australia prices are down 13% from a year ago, and 4% from April 2025
- Victoria prices are down 2% from a year ago, and 3% from April 2025
May 2025 NEM insights by state
New South Wales
- Average spot price of $123/MWh, with 56 hours of negative prices and 7 hours above $300/MWh
- A $200/MWh difference in average underlying spot prices at the cheapest and most expensive times of day
- No daily intervals with an average negative price over the whole month
- 32% total renewable generation through the month
- Minimum demand of 5,448 MW
- Peak demand of 10,959 MW
Queensland
- Average spot price of $96/MWh, with 68 hours of negative prices and 6 hours above $300/MWh
- A $200/MWh difference between the average underlying prices at the cheapest and most expensive times of day
- No daily intervals with an average negative price over the whole month
- 30% total renewable generation through the month
- Minimum demand of 4,377 MW
- Peak demand of 8,098 MW
South Australia
- Average spot price of $83/MWh, with 158 hours of negative prices and 5 hours above $300/MWh
- A $150/MWh difference between the average underlying prices at the cheapest and most expensive times of the day
- No daily intervals with an average negative price over the whole month
- 72% total renewable generation through the month
- Minimum demand of 254 MW
- Peak demand of 2,272 MW
Tasmania
- Average spot price of $103/MWh, with 14 hours of negative prices and 3 hours above $300/MWh
- A $90/MWh difference between lowest and highest time-based average underlying spot price
- No daily intervals with an average negative price over the whole month
- 98% total renewable generation through the month
- Minimum record of 923 MW
- Peak demand of 1,570 MW
Victoria
- Average spot price of $78/MWh, with 136 hours of negative prices and 3 hours above $300/MWh
- A $130/MWh difference between lowest and highest time-based average underlying spot price
- No daily intervals with an average negative price over the whole month
- 38% total renewable generation through the month
- New minimum demand record of 2,889 MW
- Peak demand of 8,060 MW
Looking ahead to June 2025
As the first ‘official’ month of winter, June typically brings cooler temperatures and a corresponding increase in electricity demand driven by heating. Historically, average electricity prices are generally higher in the winter compared to autumn or spring, due to increased demand and reduced solar generation. The extent to which prices rise in June will depend on several key factors – the severity of cold weather, the reliability and availability of generation, renewable generation, and transmission availability.
Despite the seasonal shift, the Bureau of Meteorology continues to forecast a higher-than-average likelihood of above average maximum and minimum temperatures across the east coast over the next three months. While winter will still bring cold conditions, the overall season is expected to be warmer than usual. This would likely reduce heating demand, placing downward pressure on prices.
Coal generator reliability remains a concern, with unplanned outages continuing across Queensland, New South Wales, and Victoria. At the time of writing, half of the capacity at Yallourn power station and a quarter of the capacity at Loy Yang A power station are offline (both in Victoria). These outages reduce available supply during peak demand periods, increasing the risk of price spikes.
Gas demand, particularly in Victoria, is highly driven by heating needs. The Iona underground gas storage facility, typically filled during summer and drawn down during winter entered June more than 95% full, in part to an unusually warm autumn. With forecasts pointing to a milder winter, storage levels are expected to remain higher than usual. As a result, gas spot prices are ~30% lower than at the same time last year, when Iona storage was below 80%and falling. Pressure in the gas market is a direct contributor to higher electricity prices, and the plentiful storage is likely to see gas play a lesser role in high prices this winter.
Transmission work in southern New South Wales is planned to continue through the coming months, increasing the risk of higher prices in New South Wales and Queensland. These outages previously contributed to elevated prices in May, November, and December 2024, and may again impact prices in New South Wales and Queensland. Looking ahead to the second week of June, colder weather, coal generator outages, and low wind generation are expected to drive elevated morning and evening prices. This will be a key period to watch.
Any questions? Our energy specialists are here to help.
If you’re an existing Flow Power customer, don’t hesitate to reach out to your account manager.
If you’re not a Flow Power customer, feel free to contact our friendly team:
1300 08 06 08