While the average spot price in November increased in all regions of the National Electricity Market (NEM), compared to October there has been a year-on-year softening of spot prices in November for Victoria and South Australia.
On the other hand, New South Wales had a slight year-on-year increase, and Queensland’s average spot price was more than double that of in November 2020. This is likely due to the extra pressure of the C4 unit at Callide Power Station (and its 420MW of capacity) being out of action since May due to an explosion. The coal-fired generator is set to return to service sometime in Q2 2023.
November 2021 summary
Prices during November (the second month with five-minute settlement) have been more volatile than in October, with 6 hours of prices greater than $500/MWh. This was primarily in Queensland, with half an hour of high prices in New South Wales.
The number of hours with negative wholesale prices halved in November relative to October. The fewer hours of negative prices was most likely due to the lower levels of solar (both rooftop and grid-scale) and wind generation across the NEM compared to October, in addition to higher middle-of-the-day demand across all mainland regions.
Despite the generally lower renewable output, there were still periods of very high renewable generation. There were four days in South Australia (and two in Victoria) with the average spot price going into the negatives – these corresponded with days where wind generation was higher.
In a world first (for large-scale power systems), on 21 November the South Australia grid was the first to reach the point where all the demand for energy was met and exceeded by non-scheduled generators (the majority of which is rooftop PV). Excess renewable energy generated by large scale renewables and the gas-fired power stations running in the state was sent into Victoria. While this only happened for three 5-minute intervals in the day, it is expected that more of these events would occur as South Australia increases their renewable energy capacity.
State-by-state key figures and takeaways
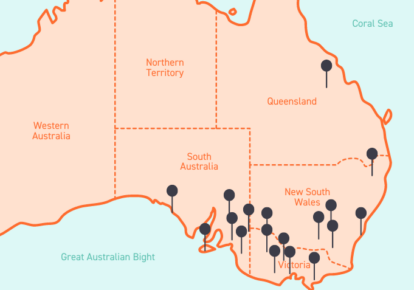
Click on our dynamic graph below to view the figures for your state:
New South Wales November 2021
- Slight increase in average spot price compared to the previous three months (though similar to November 2020)
- 24 hours of negative prices, 25 minutes of prices above $500/MWh
- A lower average demand across the day when
,compared to November 2020 - Similar average rooftop solar generation to November 2020 – previous month comparisons indicate that there should have been an increase (due to more installations), so this is likely due to high cloud coverage during the month
Queensland November 2021
- Spot price approaching the market cap (~$15,000/MWh) for six 5-minute intervals – these were relatively spread out, and there were only two hours in the month with more than one of these price spikes
- 61 hours of negative prices, 6 hours of prices > $500/MWh
- Generally similar demand profile to 2019/2020 November, with lower generation availability
- Interconnector constraints and ramp-down issues in the evening caused some price spikes which were not forecast by Australian Energy Market Operator (AEMO)
South Australia November 2021
- Negative grid demand for three 5-minute intervals on the 21 of November
- 150 hours of negative prices, which is an increase from November 2020 (92.5 hours), but a decrease from October 2021 (295 hours)
- Higher average spot price than October 2021, but lower than November 2020
- Lower than expected rooftop solar generation, likely due to cloudy days throughout the month
- Monthly average price is negative between 10:35 AM and 02:40 PM
Victoria November 2021
- Higher average spot price than the previous two months, though lower average than November 2020
- Similar peak demand to previous Novembers, with lower middle-of-the-day demand and higher availability
- 111 hours of negative prices, and no prices above $500/MWh throughout the month
- Some midday 5-minute intervals with average negative spot price, however only two back-to-back (unlike in October 2021, with a more hours consistently negative)
Looking at November 2021
In contrast to the extreme high prices and low prices seen in the latter half of 2021 so far, November saw a return to normalcy for the NEM mainland. Prices appear to be similar to those last year, though there were comparatively more hours of negative prices in the month.
November 2021 saw low rooftop solar generation, which was not unexpected due to more rain and clouds than normal for this time of year. With a La Nina officially announced by the Bureau of Meteorology, we would expect to see a cooler, wetter December – this may result in fewer extreme demand days in the month (with lower required indoor cooling), however could also come with continued subdued grid and residential solar generation.
Is it a good time to contract?
The forward contract market was looking relatively stable, up until the last week of November, when the CAL contracts for 2022, 2023, and 2024 increased.
The north/south divide in contract prices continues, which seems to indicate lower prices in Victoria and South Australia continuing through the next few years.
Q4 contract prices are equal (or slightly lower) to those at the end of October 2021, which indicates stable expectations for wholesale prices for the rest of the quarter in all regions – with a slight price premium included in the Queensland contract.
Any questions? Our energy specialists are here to help.
If you’re a Flow Power customer already, please reach out to your dedicated Client Solutions Manager.
If you’re not a Flow Power customer contact our friendly team today:
? 1300 08 06 08 (within business hours)
?️ Live chat message (within business hours via the chat button at the bottom of your screen)


