


Strong renewables output drives soft finish to spring
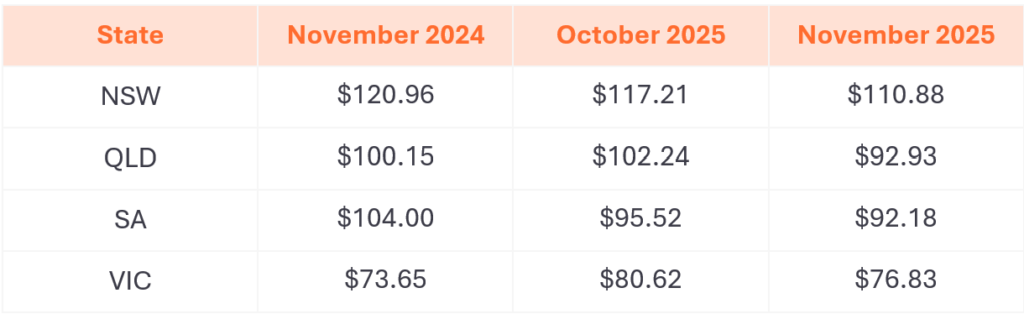
Compared to 2024, average spot prices in November 2025 were significantly weaker across the National Electricity Market (NEM). Prices fell by around 65% in Queensland and New South Wales, and by 50% in Victoria and South Australia.
Low price volatility combined with a high frequency of negative prices kept average prices in November broadly in line with October in the northern states, while prices in Victoria and South Australia fell by more than 35% month-on-month. Prices were negative for 31% of intervals in NSW and Queensland, 47% in Victoria, and around half of all intervals in South Australia.
Renewable generation was a key driver of these outcomes. Average wind generation across the NEM was 39% higher than November 2024, while grid-scale solar output increased by 16%. This strong renewable contribution offset more expensive generation, with gas generation down 45% and hydro down 25% year-on-year. Continued renewable investment, alongside additional battery capacity reducing reliance on peaking gas and hydro, is expected to maintain downward pressure on wholesale prices ahead of the next major coal plant retirement.
This near-term weakness in spot prices has flowed through to futures markets. ASX electricity futures declined across all states during November and into early December, reflecting softer short-term price expectations.
Limited volatility despite hot conditions
In November 2024, elevated prices were driven by heat-related peak demand and significant price volatility, particularly in New South Wales and Queensland. Coal and transmission maintenance outages combined with hot weather resulted in multiple days of extended evening peak price spikes.
While similar underlying supply-side risks were present heading into the month, extreme pricing failed to materialise. There were only seven five-minute intervals of very high prices in NSW across the month, five of which occurred on 25–26 November, when temperatures in Penrith exceeded 36°C.
Notably, all high-price intervals occurred outside the traditional evening peak. On 26 November, four consecutive intervals hit the market price cap of $20,300/MWh at midday, triggered by a sudden increase in demand as cloud cover moved over Sydney, sharply reducing rooftop solar output.
In early December, NSW demand peaked more than 10% higher than November’s maximum, with Penrith reaching 41.7°C. However, the absence of coincident heat in Queensland allowed sufficient interstate supply to meet demand. Prices reached $380/MWh for just one interval and remained below $250/MWh otherwise.
Further head ahead
Despite limited volatility so far, the Bureau of Meteorology continues to forecast warmer-than-average minimum and maximum temperatures across much of the east coast this summer. Prolonged heatwave conditions remain the key risk for sustained high prices, particularly if multiple days of extreme demand align across regions.
Actively managing minimum system demand
Historically, the Australian Energy Market Operator (AEMO) has focused on managing periods of peak demand. However, rapid growth in rooftop solar has pushed daytime minimum system demand to record lows, shifting operational challenges to the opposite end of the demand curve. South Australia leads this trend, with high rooftop solar penetration and relatively low underlying demand. At times, minimum demand in SA can fall below zero, with excess generation exported to Victoria via interconnectors. Extremely low grid demand presents challenges for system security, including inertia and voltage control. While infrastructure such as synchronous condensers provides support, AEMO has increasingly turned to alternative solutions.
One such measure involves directing grid-scale batteries to remain in a low or empty state of charge during the day. These batteries are placed on standby to absorb excess energy if required, helping lift grid demand. While necessary for system security, this reduces charging flexibility for affected batteries.
Negative wholesale prices during these periods signal oversupply and incentivise increased consumption. For customers exposed to wholesale prices (including those on Flow Power’s plans), shifting energy use into these low-demand, negative-price periods can reduce costs, support system security, and help maximise renewable utilisation.
New generation and batteries entering summer
Grid-scale battery capacity has increased significantly ahead of summer, marking a step-change from last year. Queensland now has more than three times the battery capacity year-on-year, capable of meeting over 10% of peak demand. New South Wales, Victoria, and South Australia have also seen substantial capacity additions.
Behind-the-meter household battery installations continue at pace, and their collective impact on peak demand during extreme heat events will be closely watched over the coming three months.
Snowy Hydro’s Hunter Power Project, the 750MW Kurri Kurri gas plant, has had its expected operational date pushed back from December 2025 to 1 February 2026, meaning it is unlikely to contribute this summer. Even so, generator availability across the NEM is expected to be strong, and sustained multi-day heat events would likely be required to place the market under significant stress.
Changes in forward contract prices for CY26
Forward contract prices for Calendar Year 2026 declined across all states in November, with the largest falls in Queensland (–$9.31) and New South Wales (–$6.33).
Spring spot-price weakness appears to be feeding into forward market expectations, with additional declines recorded in early December.
November 2025 NEM insights by state
New South Wales
- Average spot price of $76.93/MWh, with 226 hours of negative prices and 4.2 hours above $300/MWh
- $345/MWh difference in average 30-minute spot prices at the cheapest and most expensive times of day
- Average spot price was negative for four 30-minute daytime intervals
- 49% total renewable generation through the month
- Minimum demand of 4,074 MW
- Peak demand of 10,967 MW
Queensland
- Average spot price of $63/MWh, with 224 hours of negative prices and 2.5 hours above $300/MWh
- $165/MWh difference in average 30-minute spot prices at the cheapest and most expensive times of day
- Average spot price was negative or very close to zero between 9:00 AM and 1:40 PM
- 39% total renewable generation through the month
- Minimum demand of 4,405 MW
- Peak demand of 10,940 MW
South Australia
- Average spot price of $32.48/MWh, with 365 hours of negative prices and 1.25 hours above $300/MWh
- $117/MWh difference in average 30-minute spot prices at the cheapest and most expensive times of day
- Average spot price was negative or very close to zero between 7:45 AM and 4:50 PM
- 92.2% total renewable generation through the month
- Minimum demand of 32 MW
- Peak demand of 1,927 MW
Tasmania
- Average spot price of $40.51/MWh, with 21 hours of negative prices and 5 minutes above $300/MWh
- $54/MWh difference in average 30-minute spot prices at the cheapest and most expensive times of day
- No daily intervals with an average negative price over the whole month
- 100.00% total renewable generation through the month
- Minimum demand of 713 MW
- Peak demand of 1,407 MW
Victoria
- Average spot price of $31.92/MWh, with 340 hours of negative prices and zero intervals above $300/MWh
- $108/MWh difference in average 30-minute spot prices at the cheapest and most expensive times of day
- Average spot price was negative or very close to zero between 7:30 AM and 4:15 PM
- 50% total renewable generation through the month
- Minimum demand of 2,054 MW
- Peak demand of 6,906 MW
Any questions? Our energy specialists are here to help.
If you’re an existing Flow Power customer, don’t hesitate to reach out to your account manager.
If you’re not a Flow Power customer, feel free to contact our friendly team:
1300 08 06 08