


Spring brings windy conditions and low prices
Electricity prices across the National Electricity Market (NEM) fell sharply from August to September, with all mainland states (Queensland, New South Wales, Victoria and South Australia) recording declines between 30-40%, and Tasmania experiencing a dramatic 77% drop (driven largely by stronger hydro output, thanks to wetter conditions). The spring shoulder season brought warmer weather, lower demand, sunnier skies, and strong winds, combining to drive average prices lower and increase the occurrence of negative prices.
Negative spot prices occurred frequently across the NEM, particularly during solar hours and deeper during windy periods and on weekends. Prices were negative 27% of the time in New South Wales, 34% in Queensland, 35% in Victoria, and 39% in South Australia.
Peak demand declined across all states, with New South Wales recording the steepest fall – 20% lower than August levels. With a lack of significant peak demand, there were very few intervals of high prices. These subdued conditions are expected to continue through October, although rising temperatures later in spring could increase demand and shift price dynamics.
Renewables overtake coal for the first time
The spring shoulder season is when new renewable records are set, and 2025 is no exception.
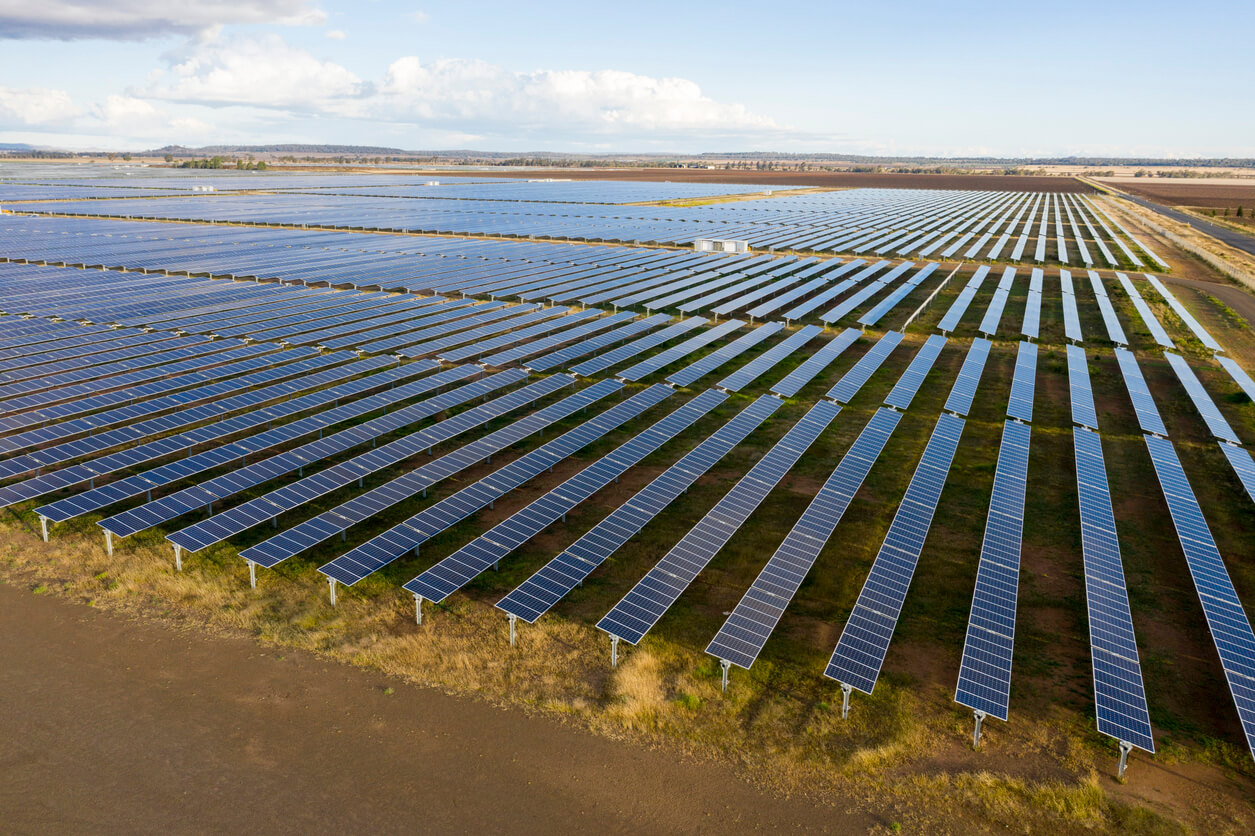
For the first time in NEM history, renewable generation surpassed coal generation, accounting for 51% of total generation in September. Globally, renewables also generated more than coal over the first half of 2025, as wind and solar output continues to rise.
On October 3 at 12:30 PM, New South Wales set a renewable penetration record of 85.91%. with rooftop solar alone meeting 50.8% as installed capacity continues to increase year on year.
On October 11 just before midday, a NEM-wide renewable penetration record of 78.63% was set, beating the previous September record of 76.4%. Rooftop solar again, provided the biggest supply of 51%.
On October 4th at midday, a new minimum grid demand record of 9,666 MW was set, and 4% lower than the previous record in spring 2024. Although total underlying demand was higher than during previous years’ records, behind-the-meter rooftop solar reduced grid reliance, meeting 57.5% of total demand at the time. This contrasts with the all-time peak demand of 38,638 MW in February 2024, highlighting the challenge of managing an increasingly volatile demand profile.
Household battery installs surge
Since the launch of the government’s Cheaper Home Batteries Program on 1 July, over 55,000 battery applications have been submitted from Australian homes and businesses – similar to the number of solar panel installations over the same period. The combined capacity of these battery applications now exceeds the operating capacity of the largest grid-scale battery in the NEM.
Increasing battery capacity in the network will help manage both minimum demand periods (by soaking up excess daytime solar generation) and peak demand events (by discharging into the grid during high price intervals). Customers on market-linked energy plans (such as Flow Power’s) can leverage these price dynamics for both savings and sustainability. Talk to our energy experts to see how a battery can fit into your energy strategy.
Coal generator maintenance outages ramp up
Coal plant maintenance in NSW took five of the twelve coal generating units offline in September. Three of these units will remain offline into November and December, raising reliability concerns as we move into summer and peak demand risks increase. Monitoring return-to-service dates will be critical in managing forward expectations.
Transmission maintenance risks in New South Wales
New South Wales and Queensland experienced significant price volatility in late 2024 due to transmission maintenance outages in southern NSW, restricting electricity flows from Victoria and southern NSW through to Sydney. These coincided with coal outages, compounding the supply challenge.
Similar transmission outages are scheduled in October and November and elevate the risk of high spot prices during evening peaks, particularly if further outages occur or demand rises unexpectedly.
Customers exposed to spot prices, can respond to high price events by reducing or shifting usage, helping to manage both cost and grid stabilityduring critical maintenance periods.
Weather outlook
According to the Bureau of Meteorology, the next three months are likely to bring above-average rainfall across the NEM, which may reduce solar generation due to increased cloud coverage. Above-average minimum temperatures are forecasted, which may dampen electricity demand while above-average maximum temperatures are forecast across most of the NEM, excluding coastal New South Wales and Sydney.
Changes in forward contract prices for CY27
Forward contract prices for Calendar Year 2027 remained largely unchanged from August to September. Price movements in all mainland regions were within ±2%, suggesting stable long-term market sentiment despite short-term volatility.
September 2025 NEM insights by state
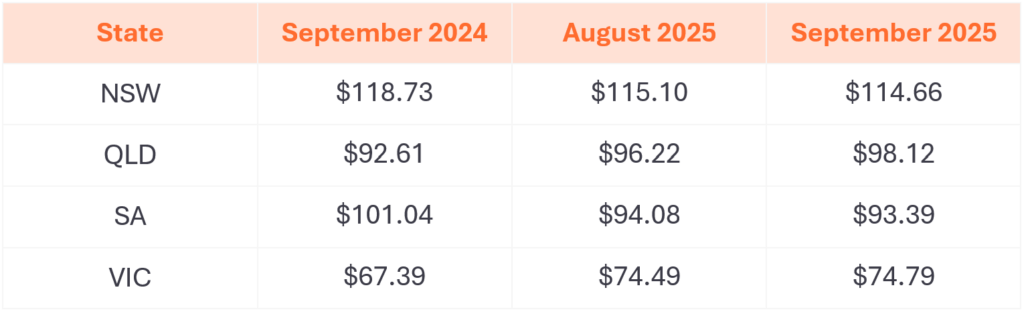
- New South Wales prices are down 3% from a year ago, less than 1% from August 2025
- Queensland prices are up 6% from a year ago, and 2% from August 2025
- South Australia prices are down 7% from a year ago, and less than 1% from August 2025
- Victoria prices are up 11% from a year ago, and less than 1% from August 2025
New South Wales
- Average spot price of $71/MWh, with 196 hours of negative prices and 7 hours above $300/MWh
- $186/MWh difference in average 30-minute spot prices at the cheapest and most expensive times of day
- Average spot price was negative or very close to zero between 10:25 AM and 2:20 PM
- 42% total renewable generation through the month
- Minimum demand of 3,807 MW
- Peak demand of 10,360 MW
Queensland
- Average spot price of $54/MWh, with 247 hours of negative prices and 2 hours above $300/MWh
- $177/MWh difference in average 30-minute spot prices at the cheapest and most expensive times of day
- Average spot price was negative or very close to zero between 7:45 AM and 3:15 PM
- 37% total renewable generation through the month
- Minimum demand of 3,742 MW
- Peak demand of 8,050 MW
South Australia
- Average spot price of $58/MWh, with 278 hours of negative prices and 9 hours above $300/MWh
- $160/MWh difference in average 30-minute spot prices at the cheapest and most expensive times of day
- Average spot price was negative or very close to zero between 10:20 AM and 3:45 PM
- 83% total renewable generation through the month
- Minimum demand of 37 MW
- Peak demand of 2,183 MW
Tasmania
- Average spot price of $29/MWh, with 84 hours of negative prices and less than 1 hour above $300/MWh
- $107/MWh difference in average 30-minute spot prices at the cheapest and most expensive times of day
- No daily intervals with an average negative price over the whole month
- 99.9% total renewable generation through the month
- Minimum demand of 887 MW
- Peak demand of 1,608 MW
Victoria
- Average spot price of $55/MWh, with 249 hours of negative prices and 7 hours above $300/MWh
- $158/MWh difference in average 30-minute spot prices at the cheapest and most expensive times of day
- Average spot price was negative or very close to zero between 10:25 AM and 3:20 PM
- 53% total renewable generation through the month
- Minimum demand of 2,399 MW
- Peak demand of 7,710 MW
Any questions? Our energy specialists are here to help.
If you’re an existing Flow Power customer, don’t hesitate to reach out to your account manager.
If you’re not a Flow Power customer, feel free to contact our friendly team:
1300 08 06 08