


2021 has been a particularly exceptional year in the National Electricity Market (NEM)
January, February and March saw lower than expected spot prices drop across all states, due to a mild and wet summer. The first quarter therefore proved to be a favourable time for businesses to lock into contracts at these low spot prices.
However, these low prices were followed by unexpected, extreme spot price volatility from May until July. There were record prices in Q2 and Q3 and the wholesale market finally returned to typical levels in Q4 the final quarter of the year.
The price hikes were felt most keenly in Queensland and New South Wales.
What influenced the market?
Market outcomes were heavily influenced by the major generation outages across the NEM. This included Torrens Island fire in SA, the Callide coal power station C4 explosion in Queensland and the Yallourn coal power station flooding in Victoria – all of which contributed to volatility in prices during the second quarter. Other variables contributing to the rise in prices were higher gas prices, a colder winter than usual, as well as outages at thermal generators, both for routine and unexpected maintenance (such as the works undertaken to get Callide and Yallourn power stations back online).
The final two quarters of 2021 proved to also be quite eventful. We saw prices drop due to the return of various offline baseload generators, multiple records broken by wind and solar generation, and the introduction of the five-minute settlement.
2021 summary
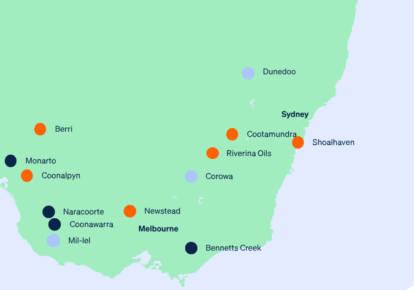
State-by-state key figures and takeaways
Click on our dynamic graph below to view the figures for your state:
2021’s quarter-by-quarter key takeaways
Q1
- Throughout the NEM, the prices in the first three months in 2021 were lower than prices in 2020 during the same period.
- Reduced demand was exacerbated by continued growth in behind-the-meter solar generation (as a result of more installations), driving down middle of the day demand, resulting in even lower demand in between the morning and evening peaks.
- The Torrens Island fire on March 3rd resulted in an immediate 670MW drop in generation. Generation availability remained low as various other thermal generators were unable to cover the drop, which caused a tight supply-demand gap. This then came with extreme price volatility, with spot prices close to or at the market cap for 6 hours.
Q2
- The second quarter delivered the highest ever Q2 spot prices in Queensland and the highest Q2 spot prices in New South Wales for a several years.
- While prices did increase between March to April, a larger increase was seen from April to May. This was likely due to the volatility caused by a number of thermal generators going offline for routine or unexpected downtime, the most prominent being the explosion of the coal-fired Callide C4 generator on the 25th of May. In addition to causing short-term power outages in Queensland, there was a long period of time after the explosion where price volatility was present in all mainland NEM regions during most evenings. The Callide C4 generator is expected to return to service sometime in Q2 2023.
- In contrast to Q1, average daily demand for the quarter was higher than previous years in most mainland regions.
Q3
- The return of generators from maintenance and repair near the end of July contributed to a large drop in monthly average price in all regions in August, with a further decrease in September.
- In addition to increased availability, solar and wind generation in the latter months of the quarter likely contributed to these reduced wholesale prices.
- Days with high wind and solar penetration also saw negative prices, and the number of hours of negative prices increased in all regions from Q3 2020.
- Demand was at similar levels to the same period in 2020 (with slight reductions in demand in the middle -of -the- day, in part due to increases in rooftop solar compared to Q3 2020).
- Renewable records were broken, with record levels of renewable energy being generated and (for a few intervals) total NEM solar output exceeded all the output of the coal generators in the NEM.
Q4
- October was the first month of five-minute settlement, which marked a large change in how spot price was calculated for energy users.
- Q4 brought some of the lowest monthly average prices seen in South Australian and Victoria.
- There were prolonged periods of negative prices across the entire NEM, In South Australia and Victoria (average, middle-of-the-day prices were negative in October and November).
- By December, increasing temperatures had led to increased demand, and the return of summer price volatility.
- Interestingly, in addition to the demand “duck curve”, the price “duck curve” is also deepening, with middle-of-the-day prices being lower than previous years, while morning and evening peak prices increasing.
- Renewable records continued to be broken, and South Australia had negative scheduled demand for the first time. (That is, semi-scheduled generation and rooftop solar provided more generation than total demand in South Australia).
- The installation of 4 synchronous condensers in South Australia allowed more generation from intermittent (generally solar and wind) generators while maintaining system strength.
Looking at energy trends for 2022
After a year full of variability in prices in 2021, all eyes are now on the upcoming summer. There are a number of elements which will keep the market guessing heading into 2022.
Summer of 2021 was affected by La Niña which contributed to unseasonably low spot prices. As La Niña will be in effect again this summer, we can expect a wetter than average January and February, with generally cooler temperatures in New South Wales and Victoria compared to Queensland and South Australia. Based on futures prices, the participants are expecting higher spot prices than we had last summer.
The effects of the change to five-minute settlement
2022 will see more effects of the change to five-minute settlements which occurred on the 1st of October, the market now settles at a five-minute granularity instead of every thirty minutes, as it used to before October. While prices were softer in the first months of the five-minute settlement, we’ve seen some early examples of price volatility in December, and the previous variability of prices under thirty-minute settlement (where dispatch prices went from $15,000/MWh to $1,000/MWh in five minutes) is nowhere to be found.
Solar on track to keep breaking records
We are expecting to see continued growth in the uptake of rooftop solar panels. Higher levels of solar output will reinforce the “duck curve”, with lower demand in the middle of the day and similar (or even higher) demand during the morning and evening peaks. This could also be reflected in the prices, with lower prices being present in the middle of the day.
We hope you’ve found these market wraps informative throughout a turbulent year in the NEM.
If you have suggestions for other analysis we can undertake for our 2022 market wraps, please let us know at hello@flowpower.com.au.
Any questions? Our energy specialists are here to help.
If you’re an existing Flow Power customer, please do not hesitate to reach out to your account manager.
If you’re not a Flow Power customer, feel free to contact our friendly team:
? 1300 08 06 08
Alternatively, you can submit your questions through our website contact form here.