In August 2022, prices have moved to lower levels than the prior three months. All regions had average monthly wholesale prices between $100-200/MWh compared to the previous averages exceeding $300/MWh.
Lower price levels appear to have resulted from several factors including lower gas prices, increased renewable generation, and decreased demand (the latter two factors typical in August as we move into spring).
Gas price update
Early in the month, the Australian Competition and Consumer Commission (ACCC) released an interim report of its inquiry into east coast gas supplies and recommended that liquid natural gas (LNG) exporters work to increase supply to Australia.
This led to a public discussion on whether the federal government should take greater action and use the “gas reservation trigger” to impose export controls and ensure domestic supply. Whether due to decreased demand (due to higher temperatures and increased renewables), increased supply (APLNG had one gasification train offline for maintenance for most of August), or fear of further regulation, gas prices for the mainland National Electricity Market (NEM) regions have dropped in August, from $25-$30/GJ to $13-$20/GJ.
While this is still above last year’s single digit average gas price, it has brought back a little price stability to the market.
Victoria/South Australia interconnector constraints
From the 15th of August, there were Heywood interconnector (one of the transmission lines linking South Australia and Victoria) outages on most weekdays. These outages limited Heywood imports into South Australia to 50 MW. In the first week of outages, there weren’t significant price impacts, mainly because South Australia’s renewable generation was operating at high capacity.
On the 25th and 26th of August, renewable generation (in particular, wind generation) was much lower than previous days in the month, and because the interconnector outages limited the generation that flows from Victoria to South Australia, there was significant price volatility. The average spot price on the 26th ($1,470/MWh) was the third highest daily average spot price in South Australia on record.
Interestingly, the availability of various generators on the 26th was similar to that on the 8th, though fewer interconnector constraints on the 8th resulted in significantly less severe price volatility (with a daily average of $335/MWh). This highlights the importance of interconnection in highly renewable power systems, allowing generation resources to be shared across state borders.
Electricity price insights
As we move into spring, increased temperatures will decrease heating demand, and solar and wind generation tend to pick up. This decrease in demand was demonstrated in all NEM regions, where the average August 2022 demand was lower at all times of day compared to July 2022. In a big milestone for renewable generation, the 4th of August saw a new record in NEM-wide wind generation producing 7,305 MW.
After initially falling during August, forward prices for 12-month contracts starting in January 2023 rose in all regions, but particularly in the two northern states. Despite falls in average spot prices, this increase in forward prices is likely due to expectations that Newcastle coal prices, which are linked to the costs of producing coal-fired electricity, will remain high as global demand for Australian thermal coal remains high.
August 2022 NEM insights – by state
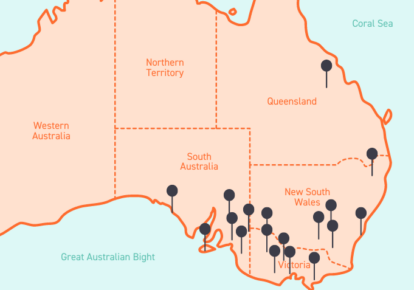
Click on our dynamic graph below to view the figures for your state:
- New South Wales is up 235% from a year ago, and 11% from July 2022
- Queensland is up 308% from a year ago, and 9% from July 2022
- South Australia is up 193% from a year ago, and less than 1% from July 2022
- Victoria is up 195% from a year ago, and 7% from July 2022
New South Wales August 2022
- Average spot price of $148.32/MWh, with 23 hours of negative prices and 22 hours above $300/MWh
- $180/MWh difference in average underlying spot prices at the cheapest (mid-morning/noon) and most expensive times of day
- 25% total renewable generation through the month
- Peak demand of 12,141 MW, and minimum demand of 5,288 MW
Queensland August 2022
- Average spot price of $133.51/MWh, with 92 hours of negative prices and 26 hours above $300/MWh
- $260/MWh difference between the average underlying prices at the cheapest and most expensive times of day, likely due to large renewable generation through the middle of the day
- 22% total renewable generation through the month
- Peak demand of 7,791 MW, and minimum demand of 3,365 MW
- New record for lowest operational demand was broken twice through August
South Australia August 2022
- Average spot price of $173.04/MWh, with 139 hours of negative prices and 74 hours above $300/MWh
- $260/MWh difference between the average underlying prices at the cheapest and most expensive times of the day
- 70% total renewable generation through the month
- Peak demand of 2,514 MW, and minimum demand of 327 MW
Victoria August 2022
- Average spot price of $121.01/MWh, with 118 hours of negative prices and 51 hours above $300/MWh
- $210/MWh difference between lowest (just after noon) and highest (evening peak) time-based average underlying spot price
- 38% total renewable generation through the month
- Peak demand of 7,551 MW, and minimum demand of 2,759 MW
Looking ahead to September 2022
In previous years, peak and minimum demand in September has been lower than August. Forecasts of higher temperatures and better renewable generation (including rooftop solar) indicate that this trend should continue in 2022.
While this combination of decreased demand and increased renewable generation would typically translate to lower wholesale spot prices (and a lower risk of price volatility), continued interconnector works on the Heywood interconnector in the first three weeks of September (1st – 2nd,6th – 9th, and 14th – 19th) means that South Australia is still at risk of price volatility on low-wind days.
This could be further exacerbated by a planned Murraylink (the second transmission link between South Australia and Victoria) outage from the 5th to the 13th of September. In addition, generators often use this “sweet spot” of the year (where heating demand drops, there isn’t much cooling demand yet, and with renewables ramping up) for planned maintenance, so the NEM may also experience a drop in availability in September. In the same vein though, current schedules show that September should also see the return of a few large thermal generators which have been down for maintenance in August.
Interestingly, the government forecasters in the USA, Japan, and India have already declared another La Nina, though Australia’s own Bureau of Meteorology (BOM) is still holding off. This is because the BOM’s La Nina declarations have different thresholds when compared to those used by their international counterparts. However, despite the BOM not yet declaring a La Nina summer, its outlook has increased to at least a 70% chance of another La Nina later this year.
The BOM is also forecasting a wetter-than-average September across all mainland NEM regions (and a drier-than-average west coast of Tasmania). This may have implications for solar generation and thermal coal quality/availability. Maximum temperatures across the NEM are forecast to be lower than in previous Septembers, though far north Queensland and Tasmania are expected to have higher average maximums in September. Minimum temperatures are expected to exceed typical September minimum temperatures across Australia.
Any questions? Our energy specialists are here to help.
If you’re an existing Flow Power customer, please do not hesitate to reach out to your account manager.
If you’re not a Flow Power customer, feel free to contact our friendly team:
? 1300 08 06 08
Alternatively, you can submit your questions through our website contact form here.


