February at a glance
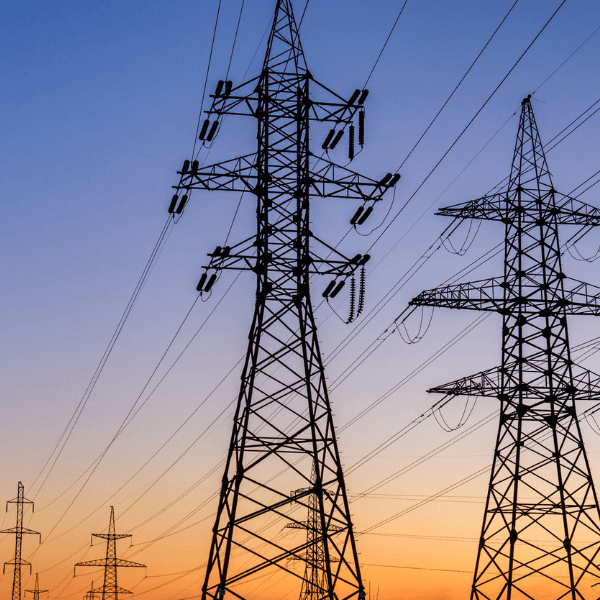
High temperatures in February resulted in increased electricity demand, with a new peak demand record reached in New South Wales, and some price volatility. Wild weather in Victoria led to a series of transmission towers collapsing, causing more than 2 GW of coal fired power to be removed from the grid instantaneously, leading to one of the largest power outages in the state.
Electricity price insights
So far this summer, demand has been slightly higher than average for New South Wales and Queensland, and slightly lower in South Australia and Victoria. This trend did not continue in February. South Australia and Victoria had similar if not slightly higher morning and evening peaks compared to historic curves.
On February 13th, high winds recording up to 130 km/h across Victoria brought down trees and damaged power lines. Subsequently, all four units of Loy Yang A were shut down causing Victoria to lose 2,690 MW of generation in a short period. Around 1,000 MW of load was also “shaken off” which involves disconnecting load due to unusual network conditions. For approximately 2 hours, Victorian energy prices reached the market cap of $16,600/MWh. Around half a million Victorians lost power, and many remained without power for multiple days. Fortunately, this situation was soon resolved with some units of Loy Yang A returning to service later that day and the rest returning within the week.
There were several days with price volatility in New South Wales and Queensland which was correlated with high total demand in both regions. When New South Wales had high demand but Queensland had low demand, prices tended to stay at lower levels. However, when both New South Wales and Queensland had high demand, one or both of the regions saw price volatility. This was most pronounced on the 29th of February, when New South Wales hit a new peak demand record of 13,867 MW and wholesale prices were in the thousands for 90 minutes, peaking at the market price cap ($16,600/MWh).
Tasmanian spot prices reached the market cap of$16,600/MWh on the 13th of February for approximately 1 hour due to lightning strikes causing transmission line trips and lost generation.
In February, the total proportion of renewable generation in the NEM was 38.88%, continuing the recent trend of breaking monthly renewable records.
Changes in forward contract prices
Forward prices for 12-month futures in New South Wales, Queensland, and Victoria, trended down in the first week of February, rebounding towards the middle of the month and resulting in prices being only slightly lower than prices at the end of January.

- New South Wales prices are down 8% from a year ago, and 3% from January 2024
- Queensland prices are up 8% from a year ago, and down 2% from January 2024
- South Australia prices are down 22% from a year ago, and 6% from January 2024
- Victoria prices are down 9% from a year ago, and down 4% from January 2024
February 2024 NEM insights by state
New South Wales

- Average spot price of $112/MWh, with 23 hours of negative prices and 14 hours above $300/MWh
- $140/MWh difference in average underlying spot prices at the cheapest and most expensive times of day
- No daily intervals with an average negative price over the whole month
- 35% total renewable generation through the month
- Minimum demand of 5,462 MW
- New peak demand record of 13,867 MW
Queensland

- Average spot price of $120/MWh, with 35 hours of negative prices and 30 hours above $300/MWh
- $200/MWh difference between the average underlying prices at the cheapest and most expensive times of day
- No daily intervals with an average negative price over the whole month
- 28% total renewable generation through the month
- Minimum demand of 5,302 MW
- Peak demand of 10,392 MW
South Australia

- Average spot price of $66/MWh, with 213 hours of negative prices and 9 hours above $300/MWh
- $180/MWh difference between the average underlying prices at the cheapest and most expensive times of the day
- Average prices were negative for all periods between 8:30 AM and 3:30 PM during the month
- 81% total renewable generation through the month
- Minimum demand of 59 MW
- Peak demand of 2,601 MW
Tasmania

- Average spot price of $82/MWh, with 24 hours of negative prices and 2 hours above $300/MWh
- $90/MWh difference between lowest and highest time-based average underlying spot price
- Three non-consecutive time intervals in the mid-afternoon with an average negative price over the whole month
- 99% total renewable generation through the month
- Minimum demand of 874 MW
- Peak demand of 1,450 MW
Victoria

- Average spot price of $83/MWh, with 170 hours of negative prices and only 5 hours above $300/MWh. Two of these hours were at the Market Price Cap on the 13th of February, when transmission outages resulted in greatly reduced generator availability and power outages across the state.
- $170/MWh difference between lowest and highest time-based average underlying spot price
- Average prices were negative for all periods between 9:00 AM and 3:00 PM during the month
- 39% total renewable generation through the month
- Minimum demand of 2,262 MW
- Peak demand of 9,575 MW – while not record breaking, this peak demand was almost 2 GW higher than January’s peak demand
February temperatures
Average temperatures in February were higher across the NEM. So high that it was the 4th hottest February across all of Australia (based on average temperature) since temperatures began recording in 1910. The Bureau of Meteorology also confirmed that Australia has warmed by 1.5°C since 1910.
Looking ahead to March 2024
The Bureau of Meteorology has forecast a hotter-than-normal March for much of the NEM, with lower-than-average rainfall. It also predicts that the majority of Australia has at least double the chance of experiencing extra warmth this autumn due to global warming.
While previous summers have had most hot days prior to March, recent heat waves and weather predictions have shown that there could still be strings of hot days to come.
An El Niño event is still active in Australia, however the Indian Ocean Dipole is neutral. The Bureau of Meteorology predicts the positive El Niño will persist until the end of April 2024. While the Bureau has not made an official announcement, a number of other weather models have predicted a return to La Nina conditions in winter this year.
Throughout March, the only scheduled base load outage is one unit of Eraring (in New South Wales) which has a 30-day planned outage from the 22nd of March, removing 720 MW from New South Wales generation. As always, there is always the risk of unplanned outages resulting in reduced capacity at any time.
Any questions? Our energy specialists are here to help.
If you’re an existing Flow Power customer, don’t hesitate to reach out to your account manager.
If you’re not a Flow Power customer, feel free to contact our friendly team:
1300 08 06 08
Alternatively, you can submit your questions through our website contact form here.


