


There were notable fluctuations in spot prices across the National Electricity Market (NEM) in February, influenced by weather, generation availability, and transmission outages. Tasmania experienced the highest average prices low levels of hydro storage and reliance on imports, while South Australia saw the biggest price increase driven by heat waves. Meanwhile, Queensland and New South Wales had varying levels of price volatility.
Electricity price insights
From January into February average spot prices rose across all states except Queensland. Tasmania had the highest average price of all states at $121.69/MWh, driven by continued dry weather putting pressure on hydro generation (which Tasmania relies on for most of its generation). This resulted in Tasmania importing energy from Victoria across Basslink 90% of the time during the month. However, the high average price in Tasmania is attributable to the higher prices for hydro as they try and conserve storage, rather than from system stress or periods of extreme price spikes. Notably, there were no trading intervals in Tasmania where the spot price exceeded $300/MWh, a typical threshold indicating tight supply-demand conditions.
South Australia experienced the greatest price increase across the states, average prices almost doubling from $48.22 in January to $91.34 in February. The consistent heat, particularly in the first two weeks, caused several high price spikes. Four of the first twelve days of February saw spot prices exceed $1,000/MWh. On these days the high prices (which weren’t reflected in AEMO’s short term price projections) occurred in the 6pm to 8pm window as solar generation tapers off but demand is still high due to hot weather.
During tight supply conditions, even small changes to expected generation can significantly impact prices. This is particularly evident in South Australia, where high rooftop solar penetration and limited interconnection with the rest of the NEM contributes to volatility. The Project Energy Connect interconnector, expected to be completed in late 2027, will link South Australia to New South Wales, facilitating greater renewable generation during windy and sunny conditions and supporting demand when it is low.
After experiencing high demand and extreme heat in January, Queensland saw minimal price volatility in February, with average spot prices falling by 35%. New South Wales experienced three short periods of price volatility early in February due to transmission maintenance which limited the transfer of generation from southern New South Wales to Sydney. These outages were similar to those that caused significant high prices in the last quarter of 2024. The impacts of these constraints on prices have so far been diluted in 2025 due to greater generation availability.
Overall, generation availability during February was very high, with only 1-2 large thermal units offline at any given time in each state. Planned maintenance of generation is intentionally limited during summer months to manage the risk of temperature-driven extremes in demand. Importantly, the reliability of generation plants through the summer was strong with only limited unplanned outages.
As we move into the autumn shoulder period, planned maintenance activities will increase as generators take the opportunity to complete required work ahead of the winter season.
In February, 44.3% of all electricity generated across the network came from renewable sources.
Changes in forward contract prices for FY26
Forward prices for 12-month futures in NEM regions typically fell through February.
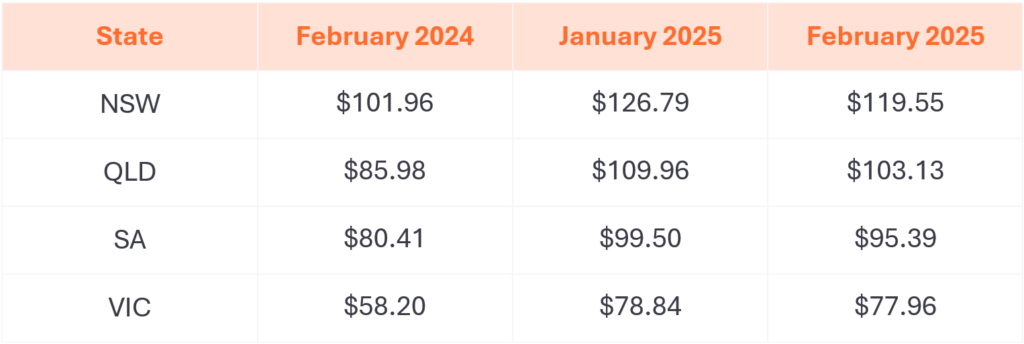
- New South Wales prices are up 17% from a year ago, and down 6% from January 2025
- Queensland prices are up 20% from a year ago, and down 6% from January 2025
- South Australia prices are up 19% from a year ago, and down 4% from January 2025
- Victoria prices are up 34% from a year ago, and down 1% from January 2025
February 2025 NEM insights by state
New South Wales
- Average spot price of $90/MWh, with 97 hours of negative prices and 5 hours above $300/MWh
- $200/MWh difference in average underlying spot prices at the cheapest and most expensive times of day
- No daily intervals with an average negative price over the whole month
- 40% total renewable generation through the month
- Minimum demand of 3,545 MW
- Peak demand of 12,391 MW
Queensland
- Average spot price of $75/MWh, with 131 hours of negative prices and 3 hours above $300/MWh
- $200/MWh difference between the average underlying prices at the cheapest and most expensive times of day
- No daily intervals with an average negative price over the whole month
- 32% total renewable generation through the month
- Minimum demand of 4,798 MW
- Peak demand of 9,465 MW
South Australia
- Average spot price of $91/MWh, with 230 hours of negative prices and 11 hours above $300/MWh
- $210/MWh difference between the average underlying prices at the cheapest and most expensive times of the day
- Average prices were negative for almost all periods between 9:00 AM and 3:30 PM during the month
- 82% total renewable generation through the month
- Minimum demand of -41 MW, meaning that South Australia’s rooftop solar was enough to cover regional demand
- Peak demand of 3,352 MW
Tasmania
- Average spot price of $122/MWh, with 8 hours of negative prices and 5 hours above $300/MWh
- $80/MWh difference between lowest and highest time-based average underlying spot price
- No daily intervals with an average negative price over the whole month
- 99% total renewable generation through the month
- Minimum record of 881 MW
- Peak demand of 1,330 MW
Victoria
- Average spot price of $69/MWh, with 174 hours of negative prices and 11 hours above $300/MWh
- $150/MWh difference between lowest and highest time-based average underlying spot price
- Average prices were close to 0 or negative for all periods between 9:00 AM and 1:00 PM during the month
- 48% total renewable generation through the month
- New minimum demand record of 2,250 MW
- Peak demand of 9,610 MW
February temperatures
The final month of summer delivered another scorcher across Australia, with the 5th highest February average temperature on record. However, this temperature increase was not evenly spread across the population centres. Particularly in the northern capitals of Brisbane and Sydney, temperatures were in line with historical averages as the inland heat failed to penetrate the coast.
South Australia set a new record for highest average maximum temperature in February, as well as the fourth highest average temperature overall. Unlike the northern capitals, the heat consistently impacted Adelaide, droving up electricity demand. Rainfall in South Australia was 78% below average for the month, similar to the rainfall deficits impacting Tasmania.
Queensland, in contrast, experienced 34% above average rainfall, mostly in the northern half of the state and had the closest to average temperatures for the month, with few extremes.
The Bureau of Meteorology is predicting a very high likelihood of above average temperatures across Australia through to July. As we move out of the summer months, the impact on electricity demand is harder to predict – will it increase cooling loads more than it reduces heating loads?
Looking ahead to March 2025
The focus of early March 2025 was the hotly anticipated landfall of Tropical Cyclone Alfred. The cyclone brough significant winds and rainfall with it. At the peak, more than 300,000 properties were left without power due to fallen distribution lines. Fortunately, the impacts of the cyclone appear to have been better than expected, in part due to the delayed landfall. The impact on electricity prices was limited as high voltage transmission and generation was largely unaffected and average demand was similar to previous weeks. The futures market predicts that March prices will be roughly in line with average prices of the last two months.
While the traditionally hottest period of summer has passed, heatwaves and resulting high electricity demands are still possible through to April. In the coming week, there is some heat due to pass through South Australia and Victoria, but temperatures are anticipated to fall short of the extremes needed to stress the system.
As daylight hours reduce, solar generation will decline. However, this is likely to be balanced by reducing demand as heat driven cooling demand falls.
Thermal generation outages are due to begin at the end of March in Victoria and will pick up into April with a number of New South Wales and Queensland coal generators scheduling lengthy outages, ranging from two weeks to two months.
Transmission work in southern New South Wales, scheduled in the Network Outage Schedule (NOS) over the next four months, poses an increased risk for higher prices in New South Wales prices and lower prices in Victoria. However, the Australian Energy Market Operator (AEMO) has demonstrated it is prepared to recall these outages in response to tight system conditions if needed.
Any questions? Our energy specialists are here to help.
If you’re an existing Flow Power customer, don’t hesitate to reach out to your account manager.
If you’re not a Flow Power customer, feel free to contact our friendly team:
1300 08 06 08
Alternatively, you can submit your questions through our website contact form here.