Insights about the national energy market in January 2022
As the new year kicks off, we’re seeing a continuing trend of increasing energy market spot prices that started in October 2021. Spot prices in January 2022 were officially higher than in December 2021, however we can consider this normal for summer in Australia.
So why were energy prices and demand higher in January 2022? As is often for Australian summers, our high temperatures can lead to high energy demand. For example, more people than usual power up appliances such as air conditioners to combat hot temperatures. These often sudden and synchronised surges of energy consumption usually result in higher spot prices because increased energy generation is required to meet our power needs.
Partly due to this year’s “La Nina” summer conditions, January 2022 had higher average maximum temperatures compared to January 2021 (though not as high as the extremes of January 2020).
The impacts of January’s warmer conditions on energy prices were then exacerbated by low availability of thermal generators in Queensland. Unfortunately a number of Queensland thermal generators were unavailable due to scheduled and emergency maintenance.
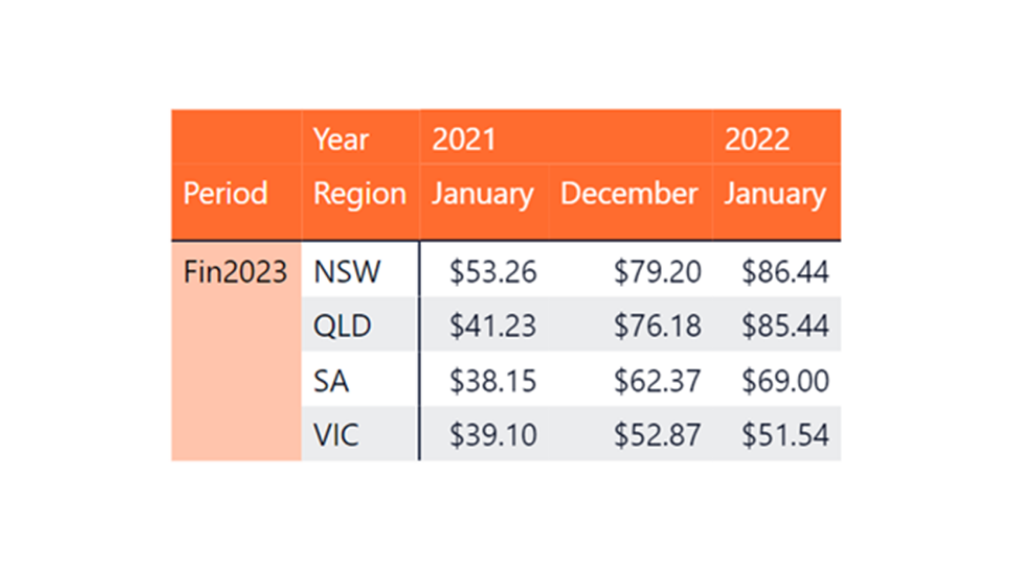
Higher spot prices continue to lend support to forward contract prices, as can be seen from examining traded price for 2023 financial year prices. The average January 2022 spot prices are compared to the average spot prices in January 2021 and December 2021 across the NEM (National Energy Market) states.
- New South Wales is up 62% from a year ago, and 9% from December 2021
- Queensland is up 107% from a year ago, and 12% from December 2021
- South Australia is up 81% from a year ago, and 11% from December 2021
- Victoria is up 32% from a year ago, but down 3% from December 2021
A run of hot days coincided with low renewable generation on the 31 January, and resulted in around an hour of high prices in VIC and SA, and two hours in QLD.
There were fewer intervals with negative prices in January NEM-wide, with 207 hours of spot prices below $0/MWh (compared to 281 hours in January 2021 and 410 hours in December 2021).
What does this mean for energy contracts?
Higher spot prices continue to lend support to forward contract prices, as can be seen from examining end of month Fin 2023 prices (which relate to the 12 months from July 2022 to June 2023).
Despite a dip in 2nd half of January, forward 12-month contracts for all mainland NEM regions except Victoria have increased throughout the month.
Contracts for Q1 2022 rose in Queensland, fell in Victoria and New South Wales, and remained stable in South Australia. This indicates stability in prices in all mainland regions except Queensland, where the lower proportion of renewable generation and current generator outages have resulted in a price premium.
January 2022 NEM insights – by state
Click on our dynamic graph below to view the figures for your state:
New South Wales January 2022
- Average spot price of $77.17/MWh, and the price never exceeding $300/MWh
- Very similar demand profile to January 2021, with slightly higher overnight demand
- Relatively flat spot price profile (small spread between daytime low and high prices)
- Despite similar demand and higher availability, NSW prices in January 2022 were higher than those in 2021. One potential cause of this is the higher thermal generation costs; higher gas and coal prices compared with a year earlier has led to an increase in generator bids from some coal generators. There is now a large proportion of generation being bid at a higher price, resulting in the higher spot prices in general.
Queensland January 2022
- Average spot price of $139.90/MWh
- Higher demand throughout the day compared to January 2021, likely due to higher temperatures
- Lower availability due to various thermal generators unavailable due to both scheduled and unplanned maintenance
- Periods of constrained interconnector capacity, limiting the ability for QLD to accept flows of cheaper electricity from NSW
South Australia January 2022
- Average spot price of $88.95/MWh
- Average spot price of $88.95/MWh
- High temperatures on the 10th and 11th resulted in increased demand, and low wind generation on those days resulted in high spot prices
- The 20th and 21st were also hot days, but were also the two highest wind generation days, which helped offset demand and soften prices
- Lower than expected rooftop solar generation, and days with low solar and low wind coincided with high spot prices
- Higher demand than in January 2021, likely due to increased temperatures
Victoria January 2022
- Average spot price of $60.82/MWh
- Higher average demand at all times compared to January 2021, especially in the evening peak, likely due to sustained high temperature days
Looking at Feburary 2022
With higher temperatures in January, we had the opportunity to observe the impact of 5-minute settlement and how it affects price volatility. On 31 January there were high prices sustained near the maximum spot price in several regions. Previously, under 30-minute settlement, price volatility caused by typical supply-demand shortfalls would often result in prices hitting the maximum price cap for a single dispatch interval, and then rebidding would cause prices to fall rapidly. Under 5-minute settlement, the incentive to rebid after a single dispatch interval no longer existed, resulting in more sustained high prices (we provided a longer explainer on the change to five-minute settlement here)
Looking forward, the Bureau of Meteorology forecasts maximum temperatures in South Australia, Queensland, and parts of Victoria to exceed the historical median, seemingly indicating a hotter than average February – this aligns with the existing La Nina season.
Any questions? Our energy specialists are here to help.
If you’re an existing Flow Power customer, please do not hesitate to reach out to your account manager.
If you’re not a Flow Power customer, feel free to contact our friendly team:
? 1300 08 06 08
Alternatively, you can submit your questions through our website contact form here.


