


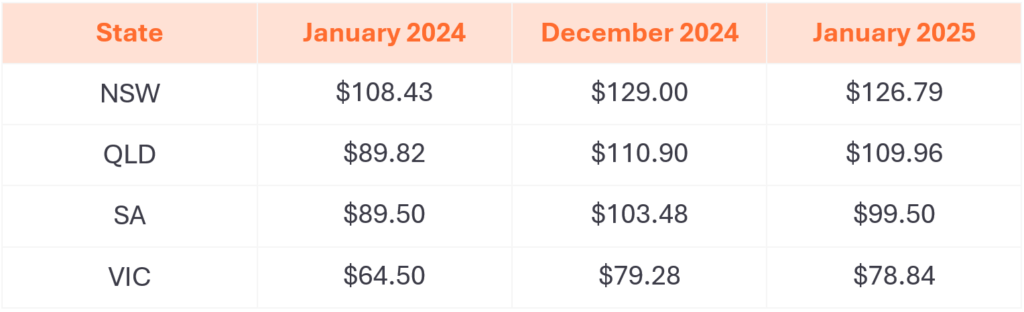
Average spot prices dropped across mainland states from December into January, with New South Wales experiencing the sharpest decline at almost 40%. Meanwhile, Tasmanian saw a significant 50% price increase driven by ongoing dry conditions that continue to put pressure on hydro generation volumes. January rainfall was under half of the average, leading to a 35% reduction in Hydro Tasmania’s generation from December, and a 26% decrease from January 2024. With little relief expected from these dry conditions, it is likely Tasmania will face continued pressure on prices in the near term.
The highest monthly price was recorded in Queensland at $114.01 ($0.38 higher than Tasmania). A new all-time maximum demand record for Queensland was set on 22nd of January, followed by a third-highest maximum demand record two days later the 24th of January. The peak demand on the 22nd of January was ~500MW higher than forecast, which took both AEMO and the market by surprise. This triggered a surge in spot prices above $10,000, lasting almost two hours and underscoring the unpredictability of demand during extreme conditions.
Interestingly, despite not being the hottest day of the month, the 22nd of January saw demand more than 10% higher than on the hottest day a week earlier in Brisbane. This highlights the challenges of accurately predicting demand in the face of fluctuating weather patterns and unexpected spikes.
Electricity price insights
In December, 44.5% of all electricity generated across the network came from renewable sources marking the fifth-highest monthly share on record.
Generation availability during January was high, with only 1-2 large thermal units offline at any one time in each state. This stability helped manage the market through a very hot January, which was the second hottest on record for Australia and in the top 5 for the east coast with very limited periods of high price volatility.
Prices in the northern states remained structurally higher than in the southern states. Queensland ($114.01) and New South Wales ($83.34) had average prices about twice as high as Victoria ($48.35) and South Australia ($48.22). A significant driver of the lower southern prices was the occurrence of negative prices; which applied to 30% of the month in Victoria and 35% in South Australia. Queensland and New South Wales also saw negative prices, for 20% and 16% of the month, respectively.
These negative prices primarily result from high solar generation during the sunny summer months when supply sometimes exceeds demand. As we move into the coming months, all eyes will be on weather forecasts, with potential heatwaves on the horizon likely to continue influencing energy generation and pricing.
Changes in forward contract prices for CY25
Forward prices for 12-month futures in mainland regions apart from South Australia ended the month higher than they started.
- New South Wales prices are up 17% from a year ago, and down 2% from December 2024
- Queensland prices are up 22% from a year ago, and down 1% from December 2024
- South Australia prices are up 11% from a year ago, and down 4% from December 2024
- Victoria prices are up 22% from a year ago, and down 1% from December 2024
January 2025 NEM insights by state
New South Wales
- Average spot price of $83/MWh, with 118 hours of negative prices and 3 hours above $300/MWh
- $170/MWh difference in average underlying spot prices at the cheapest and most expensive times of day
- No daily intervals with an average negative price over the whole month
- 41% total renewable generation through the month
- Minimum demand of 4,974 MW
- Peak demand of 12,294 MW
Queensland
- Average spot price of $114/MWh, with 148 hours of negative prices and 8 hours above $300/MWh
- $200/MWh difference between the average underlying prices at the cheapest and most expensive times of day
- No daily intervals with an average negative price over the whole month
- 33% total renewable generation through the month
- Minimum demand of 4,954 MW
- A new peak demand record of 11,316 MW
South Australia
- Average spot price of $48/MWh, with 256 hours of negative prices and 3 hours above $300/MWh
- $160/MWh difference between the average underlying prices at the cheapest and most expensive times of the day
- Average prices were negative for almost all periods between 9:00 AM and 4:00 PM during the month
- 85% total renewable generation through the month
- Minimum demand of 75 MW
- Peak demand of 2,576 MW
Tasmania
- Average spot price of $114/MWh, with 27 hours of negative prices and 1 hour above $300/MWh
- $45/MWh difference between lowest and highest time-based average underlying spot price
- No daily intervals with an average negative price over the whole month
- More than 99% total renewable generation through the month
- Minimum record of 114 MW
- Peak demand of 815 MW
Victoria
- Average spot price of $48/MWh, with 221 hours of negative prices and less than 1 hour above $300/MWh
- $145/MWh difference between lowest and highest time-based average underlying spot price
- Average prices were negative for all periods between 9:00 AM and 2:00 PM during the month
- 46% total renewable generation through the month
- New minimum demand record of 1,536MW
- Peak demand of 8,988 MW
January temperatures
Average temperatures across Australia were over 2oC hotter than usual in January, with rainfall significantly lower than average.
Queensland recorded its equal highest average January maximum temperature, and sixth highest average temperature overall. In Victoria, both maximum and minimum temperatures were in the highest 10% of records while South Australia’s average maximum temperature was the fourth highest on record.
The Bureau of Meteorology continues to predict a higher-than-average likelihood of warmer than usual temperatures in Adelaide, Melbourne, and Brisbane over the coming three months which could have significant impact on energy demand and market prices, especially during periods of high air conditioning usage.
Looking ahead to February 2025
Despite a run of extreme temperatures early in February, with Melbourne peaking above 37oC 2-4 February, there has been little price volatility in Victoria attributed to high generator availability and strong renewable output, keeping wholesale prices in check.
Futures prices for Q1 2025 have dropped as the risk of hot weather driving price volatility has not materialised so far. The medium-range outlook through the middle of the month includes some 40oC+ temperatures forecast for South Australia and mid 30s for Victoria, with little extreme heat expected in New South Wales or Queensland.
If the anticipated hot weather fails to trigger price volatility, February prices are likely to align with January’s levels. However, if hot weather arrives later in the month, it could stress the system and lead to higher prices.
Transmission work in southern New South Wales, scheduled in the Network Outage Schedule (NOS) over the next four months, poses an increased risk for higher New South Wales prices and lower Victorian prices. However, the Australian Energy Market Operator (AEMO) has re-called one of these outages this week in response to tight system conditions in New South Wales, showing that they are prioritising system security to reduce the likelihood of extreme price spikes.
Any questions? Our energy specialists are here to help.
If you’re an existing Flow Power customer, don’t hesitate to reach out to your account manager.
If you’re not a Flow Power customer, feel free to contact our friendly team:
1300 08 06 08
Alternatively, you can submit your questions through our website contact form here.