


Electricity price insights
From February to March, average spot prices fell in South Australia and Tasmania, while remaining steady in Queensland, New South Wales, and Victoria. Tasmania had the highest average price across all states at $100.04/MWh, as another month of below-average rainfall continued to put pressure on hydro generation volumes. During the month, Tasmania imported energy from Victoria across Basslink 86% of the time, compared to 90% in February. In March, 40.4% of all electricity generated across the NEM came from renewable sources, compared to 44.3% in February.
Cyclone Alfred
The highly anticipated landfall of Tropical Cyclone Alfred occurred early in the month. The cyclone brought significant winds and rainfall, and at its peak, more than 300,000 properties were left without power due to fallen distribution lines. Fortunately, the cyclone’s impacts were less severe than expected, partly due to the delayed landfall. The impact on electricity prices was limited, as high-voltage transmission and generation were largely unaffected, and average demand remained consistent with previous weeks. Rainfall in Queensland was more than twice the monthly average, which impacted solar generation – reducing it by 26% compared to February.
Temperature records broken
March 2025 was the warmest on record for Australia, with temperatures 2.41oC above average, marking the warmest 12-month period on record. This record was not driven by traditional heat waves, as no capital city in the NEM exceeded 40 degrees. Instead, heat was consistent throughout the month, with Queensland, New South Wales, and South Australia all experiencing the highest average minimum daily temperatures on record. The Bureau of Meteorology noted the absence of low-pressure systems that typically bring cooler temperatures during this time.
The lack of extreme heat and high peak demand meant that there was little price volatility in March. Only two days in New South Wales and one day in Queensland saw prices exceed $10,000/MWh. The main cause of these high price periods was elevated demand coinciding with transmission work in southern New South Wales. This work restricted the flow of power from Canberra to Sydney, limiting the ability of generation in southern New South Wales or the interconnector from Victoria to meet the demand in Sydney (where the New South Wales price is set).
Outages
Transgrid has updated the Network Outage Schedule (NOS), with transmission work expected in southern New South Wales for the remainder of 2025 and into 2026. While this work is expected to benefit the system in the long term, it will likely drive ongoing price volatility in New South Wales and Queensland, especially when it coincides with generator outages or high demand.
The impact of these transmission outages has already been felt in April, as both planned and unplanned generator outages have significantly reduced coal generation capacity in New South Wales and Queensland. At the time of writing, 8 of the 34 large coal units in both states are offline, including all units at Mt Piper, one of the 4 coal generating stations in New South Wales. While the autumn shoulder season is traditionally used for maintenance, the additional unplanned unit outages are contributing to tighter market conditions in the northern states.
With low coal generation availability expected to continue into May, and ongoing transmission restrictions, there is a significant risk of volatile prices, particularly in the evening peak, after solar generation has ramped off. Customers on wholesale-linked plans, such as Flow Power’s, have the potential to achieve significant savings if they can shift consumption away from these high price periods.
Changes in forward contract prices for FY26
Forward prices for 12-month futures in NEM regions typically rose marginally through March.
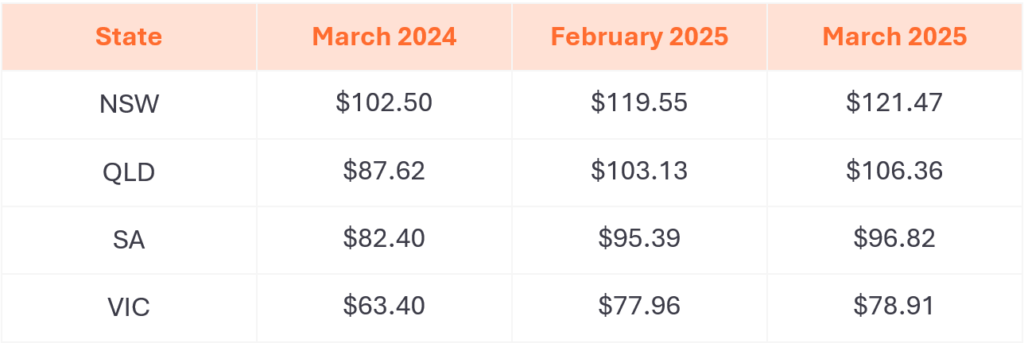
- New South Wales prices are up 19% from a year ago, and 2% from February 2025
- Queensland prices are up 21% from a year ago, and 3% from February 2025
- South Australia prices are up 18% from a year ago, and 1% from February 2025
- Victoria prices are up 24% from a year ago, and 1% from February 2025
March 2025 NEM insights by state
New South Wales
- Average spot price of $90/MWh, with 73 hours of negative prices and 3 hours above $300/MWh
- $160/MWh difference in average underlying spot prices at the cheapest and most expensive times of day
- No daily intervals with an average negative price over the whole month
- 37% total renewable generation through the month
- Minimum demand of 5,480 MW
- Peak demand of 12,412 MW
Queensland
- Average spot price of $79/MWh, with 105 hours of negative prices and 2 hours above $300/MWh
- $180/MWh difference between the average underlying prices at the cheapest and most expensive times of day
- No daily intervals with an average negative price over the whole month
- 28% total renewable generation through the month
- Minimum demand of 5,100 MW
- Peak demand of 9,103 MW
South Australia
- Average spot price of $62/MWh, with 196 hours of negative prices and 2 hours above $300/MWh
- $160/MWh difference between the average underlying prices at the cheapest and most expensive times of the day
- Average prices were negative for almost all periods between 9:30 AM and 3:00 PM during the month
- 82% total renewable generation through the month
- Minimum demand of 95 MW
- Peak demand of 2,867 MW
Tasmania
- Average spot price of $100/MWh, with 6 hours of negative prices and 1 hour above $300/MWh
- $80/MWh difference between lowest and highest time-based average underlying spot price
- No daily intervals with an average negative price over the whole month
- 99% total renewable generation through the month
- Minimum record of 858 MW
- Peak demand of 1,383 MW
Victoria
- Average spot price of $62/MWh, with 149 hours of negative prices and less than 1 hour above $300/MWh
- $130/MWh difference between lowest and highest time-based average underlying spot price
- Average prices were close to 0 or negative for all periods between 10:00 AM and 12:30 PM during the month
- 42% total renewable generation through the month
- New minimum demand record of 2,114 MW
- Peak demand of 8,591 MW
March temperatures
As mentioned, March 2025 was the warmest on record for Australia, with temperatures 2.41°C above average, marking the end of the warmest 12-month period on record. Queensland recorded its highest average minimum temperature and 6th highest average temperature overall. Rainfall was 224% of average, the wettest March since 2011.
New South Wales had the highest average minimum and average temperature on record, with its average maximum temperature also ranking as the 9th highest. Rainfall was significantly above average for much of northern New South Wales.
Victoria experienced its second highest average temperature and 4th highest average maximum temperature on record. For those living in Melbourne, the weather could be described as ‘Goldilocks weather’ – not too hot and not too cold.
South Australia recorded the highest average minimum and average temperature on record. Rainfall was low in the south of the state but very high in the north.
The Bureau of Meteorology is predicting a very high likelihood of above-average temperatures across the East Coast through to July. April is expected to experience ongoing above-average rainfall across northern New South Wales and Queensland, followed by drier-than-average conditions across the East Coast from May to July.
Looking ahead to April 2025
With significant and ongoing coal generation unavailability and transmission restrictions in southern New South Wales, any periods of elevated demand in the northern states are likely to result in high price volatility. This dynamic played out in the first week of April where evening prices on Monday 7th April, spiked to $10,000/MWh in New South Wales and Queensland.
Although April is traditionally a mild month, the shift from daylight savings time, which brings solar generation to a close earlier in the evening, increases the risk of cooler, still evenings, driving up evening demand and resulting in elevated prices.
The electricity futures market for Q2 in New South Wales and Queensland has risen, reflecting the increased risk of higher prices due to additional generation outages. Further generation outages or cold weather driven high demand could push spot prices higher. However, if generation availability improves, Easter sees lower demand conditions, or there is strong wind and solar generation, spot prices may fall and futures market expectations could drop.
As the month progresses, significant uncertainty in price forecasts, particularly for evening peaks, as market participants adjust their bids in response to their market positions and price expectations.
Any questions? Our energy specialists are here to help.
If you’re an existing Flow Power customer, don’t hesitate to reach out to your account manager.
If you’re not a Flow Power customer, feel free to contact our friendly team:
1300 08 06 08
Alternatively, you can submit your questions through our website contact form here.