Energy market outcomes in September 2022 followed closely to those in August 2022, with similar average prices, hours of negative prices, and spot price profiles across the National Electricity Market (NEM). This explains the steep fall in electricity prices since the winter of 2022, however wholesale prices remain significantly elevated (2-3 times higher) compared to September 2021.
Gas prices slowly climbed in the first half of the month but then decreased in the second half, ending up at a similar point to mid-August. Average demand throughout September was generally lower than in August, and increased solar generation resulted in higher renewable generation in September.
Large Generation Certificates
Throughout the month, Large Generation Certificate (LGC) prices initially rose from $60 to $70 in the first half of the month, before dropping a couple of dollars in the last week of September. In addition to impacting energy consumers interested in green energy, this price increase also affects the cost-benefit dynamics of renewable generators. Higher LGC prices might incentivise generators who are eligible for LGC generation to lower the price of their bids, as the financial reward of generating LGCs may offset the cost of lower bids. Interestingly, this is sometimes reflected in the spot price when prices go negative, with the majority of negative spot prices generally not going below the negative of the LGC market price.
Interconnector constraints
In the first two weeks of the month, constraints in the Heywood interconnector limited flows from Victoria to South Australia. The effect on spot price in South Australia was compounded by maintenance on Murraylink (the other interconnector between South Australia and Victoria) leaving the interconnector out of service. While there were only a couple of days where both interconnectors were out of service, it was enough for prices to go above $10,000/MWh. These higher prices occurred when there were low levels of South Australian wind generation.
Interestingly, the interconnector outages also resulted in prices in South Australia going quite low when the wind was blowing and the sun was shining. This is because when the interconnectors are in service, any excess generation can be exported to the rest of the NEM (via Victoria).
Electricity price insights
Spring has brought increased temperatures and longer, sunnier days, which had the two-fold effect of decreasing demand and increasing solar generation. Renewable milestones continued to be hit, with record high renewable generation (64.6% of total NEM generation came from renewables) being recorded on the 18th of September. Additionally, record low operational grid demand (which is mostly due to solar generation behind the meter reducing demand for electricity from the grid) was recorded on the 25th of September.
Forward prices for 12-month contracts starting in January 2023 rose in all regions in the first half of September, before seeing a slight drop in the middle of the month, then a rise in the last week. As a reminder, this increase in forward prices is likely due to market expectations of fuel costs (both coal and gas) despite spot prices remaining at similar levels to August 2022.
September 2022 NEM insights – by state
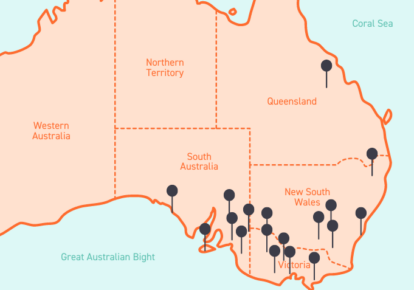
Click on our dynamic graph below to view the figures for your state:
- New South Wales is up 219% from a year ago, and 9% from August 2022
- Queensland is up 263% from a year ago, and 12% from August 2022
- South Australia is up 193% from a year ago, and less than 26% from August 2022
- Victoria is up 196% from a year ago, and 14% from August 2022
New South Wales September 2022
- Average spot price of $153.87/MWh, with 54 hours of negative prices and 15 hours above $300/MWh
- $200/MWh difference in average underlying spot prices at the cheapest (mid-morning/noon) and most expensive times of day
- 28% total renewable generation through the month
- Peak demand of 10,902 MW, and minimum demand of 4,197 MW
Queensland September 2022
- Average spot price of $156.90/MWh, with 80 hours of negative prices and 51 hours above $300/MWh
- $260/MWh difference between the average underlying prices at the cheapest and most expensive times of day, likely due to large renewable generation through the morning and middle of the day
- 25% total renewable generation through the month
- Peak demand of 7,423 MW, and minimum demand of 3,310 MW
South Australia September 2022
- Average spot price of $147.84/MWh, with 155 hours of negative prices and 39 hours above $300/MWh
- $260/MWh difference between the average underlying prices at the cheapest and most expensive times of the day, with some times of the day averaging negative prices for the entire month
- 73% total renewable generation through the month
- Peak demand of 2,194 MW, and minimum demand of 161 MW
- At times during the month, wind generation alone was able to supply >100% of SA demand
Victoria September 2022
- Average spot price of $111.77/MWh, with 107 hours of negative prices and 9 hours above $300/MWh
- $220/MWh difference between lowest (just around noon) and highest (evening peak) time-based average underlying spot price
- 37% total renewable generation through the month
- Peak demand of 7,130 MW, and minimum demand of 2,350 MW
Looking ahead to October 2022
Looking at energy market outcomes between September and October in previous years, there are typically lower levels of peak and minimum demand in October (before both tend to rise in November). This is because the milder temperatures through October led to decreased heating demand, and limited cooling demand. Simultaneously, longer, sunnier days increase renewable generation, particularly from rooftop and utility-scale solar. We expect these historical trends to continue in October 2022.
Where South Australia was at risk of price volatility in early September due to interconnector constraints, there are no further planned constraints between South Australia and Victoria through October. In addition to reducing volatility in South Australia, this could also reduce prices in Victoria, as excess renewable generation can be exported from South Australia during high renewable days.
There are a series of planned generator outages through October in all regions, with durations ranging from two days all the way up to 60 days. This is not cause for concern, as typically October’s lower demand is a safer time for generators to have planned outages (due to lower demand/supply needs).
As expected, The Bureau of Meteorology officially declared a third La Nina event . This means that we should be experiencing a wetter and colder than average couple of months coming up. This matches up with the BOM’s October outlook, which forecasts a very likely chance of above average rainfall across the east half of Australia, and lower maximum temperatures across south-eastern part of the continent.
Any questions? Our energy specialists are here to help.
If you’re an existing Flow Power customer, please do not hesitate to reach out to your account manager.
If you’re not a Flow Power customer, feel free to contact our friendly team:
? 1300 08 06 08
Alternatively, you can submit your questions through our website contact form here.


