


The NEM appears to have stabilised in August, and prices were much softer compared to what we’ve seen in the previous three months. To put this in some context, average spot prices compared to July 2021, have essentially halved in August.
This has been the result of increasing availability (due to more generators returning to service) and similar or lower demand in the four mainland regions. Average prices for the month were lower than August 2020 in SA and VIC, while only marginally higher in QLD and NSW.
Cap Payouts were at or close to 0 in all regions, indicating that the trading price did not exceed $300/MWh often during the month. While there were a handful of days where AEMO predicted price spikes, these never eventuated – this resulted in August 2021 being the first month since September 2020 to have no trading prices above $500/MWh.
It’s important to note that three of the four mainland NEM regions were in lockdowns for periods of August, and this could have affected supply/demand dynamics.
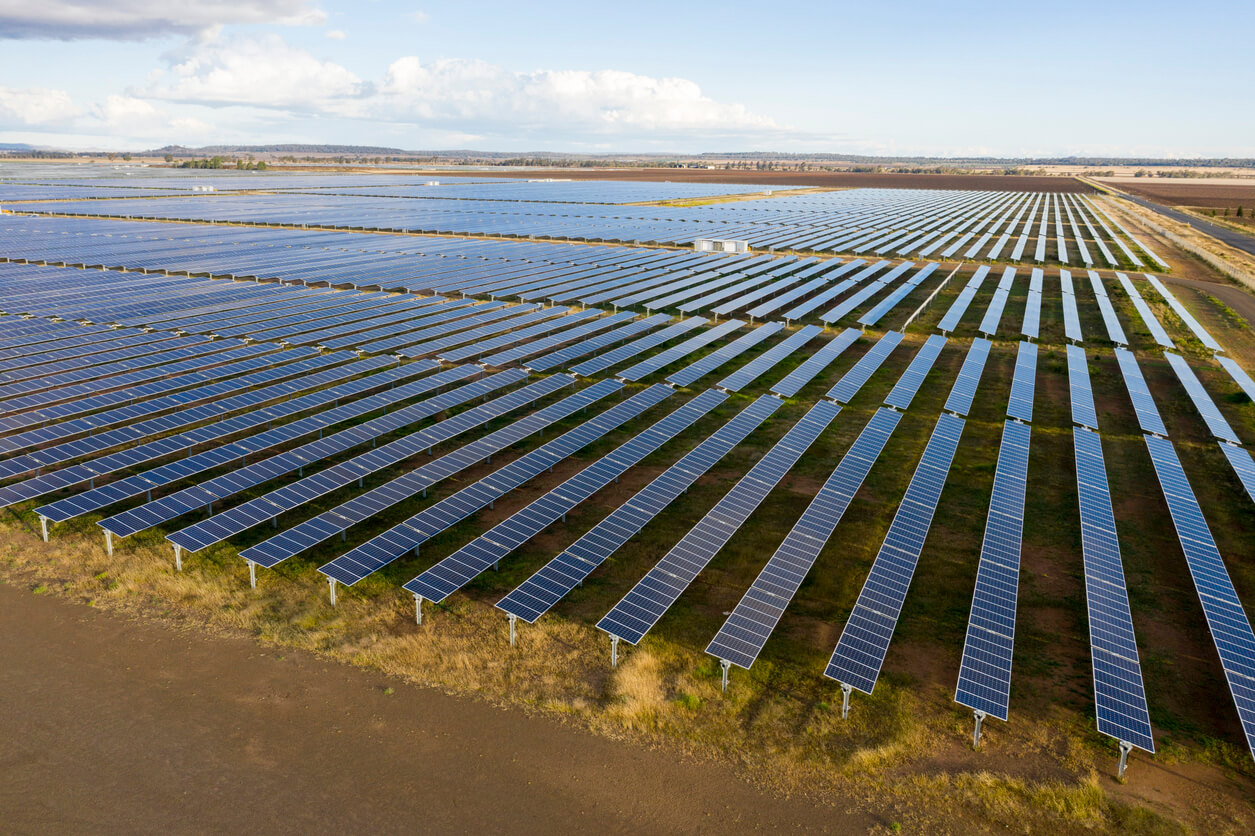
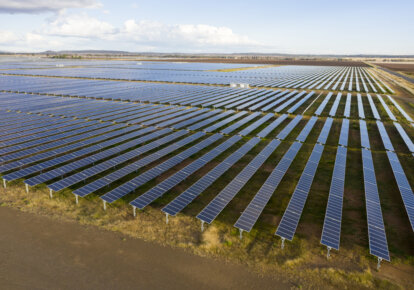
Renewable generation continues to increase across the NEM, with total solar generation (both rooftop and grid-scale) surpassing total coal generation for a single dispatch interval – in the 5 minutes ending at 12:35 PM on Sunday the 22nd of August, 41.1% of the total generation of the NEM was met by coal, whereas 41.2% was met by total solar generation. While a single dispatch interval may not seem like a big deal, it’s a significant first for the NEM, and the frequency of it occurring should only increase in the future. Solid wind generation throughout the month saw lower prices as well, with the effect on higher wind generation lowering prices visible in all regions (though stronger in South Australia and Victoria).
Let’s have a look at the unique trends across each state
New South Wales
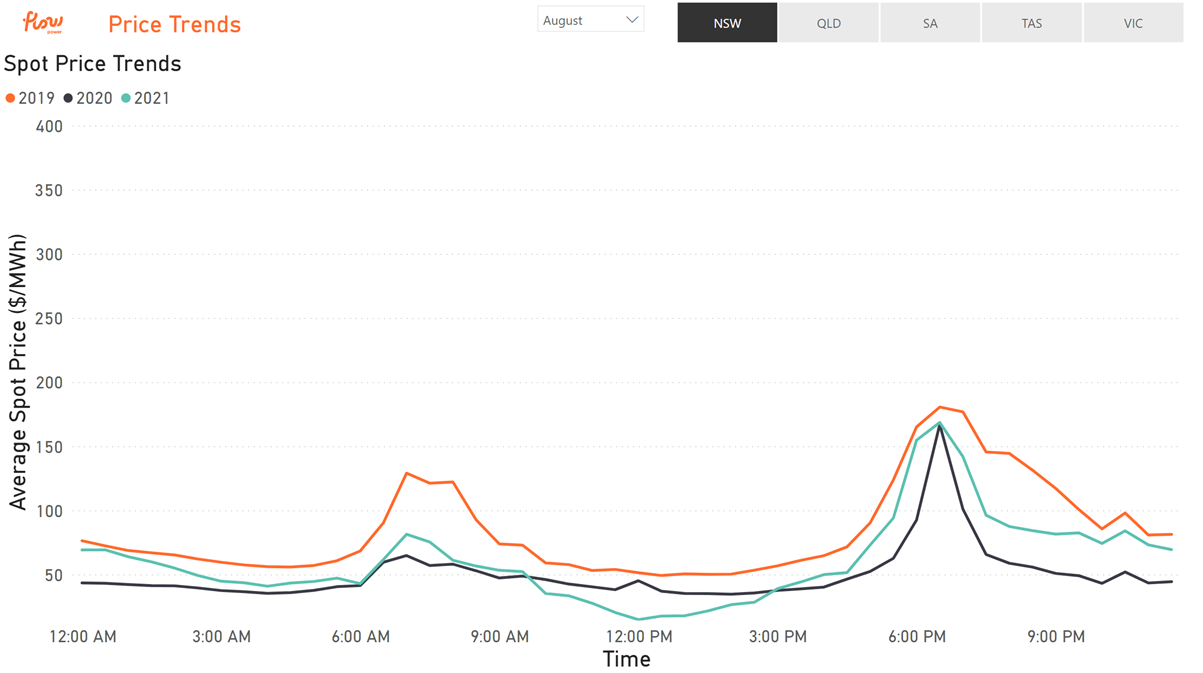
- Average spot price almost halved from July
- Average demand was lower at all times of the day compared to August in both 2020 and 2019
- Availability was higher than both those years as well, resulting in decreased pressure across the region
- Average rooftop solar generation increased by around 30% from last year
Queensland

- For the first month since September 2020, Queensland had no trading prices greater than $500/MWh.
- Queensland had a single dispatch price spike of around $1900/MWh on the 25th, but averaging meant that the trading price still settled to less than $500/MWh
- As expected, the return of Callide 3 near the end of July increased supply by around 400MW, and decreased the strain on the system – this resulted in less pricing volatility.
- The demand curve of Queensland showed similar or higher evening peak demand, with lower middle-of-the-day demand, illustrating the impact of solar generation on the power system
South Australia
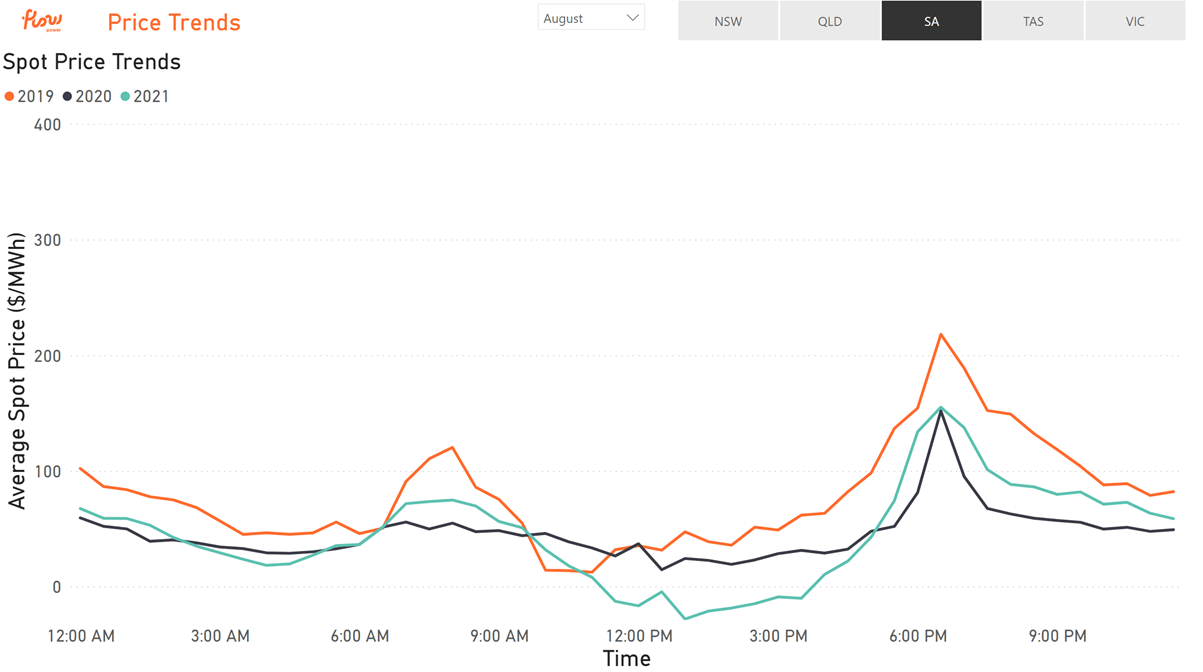
- Wind and solar (both rooftop and grid-scale) generation resulted in high renewables penetration in the market, which resulted in lower prices throughout August
- While demand throughout most of the 24 hours of a day are similar to previous years, middle-of-the-day demand decreased (compared to the previous two years)
- This comes hand in hand with increased solar generation during these times, and drove average prices between 11:00 AM and 03:00 PM negative for August
Victoria
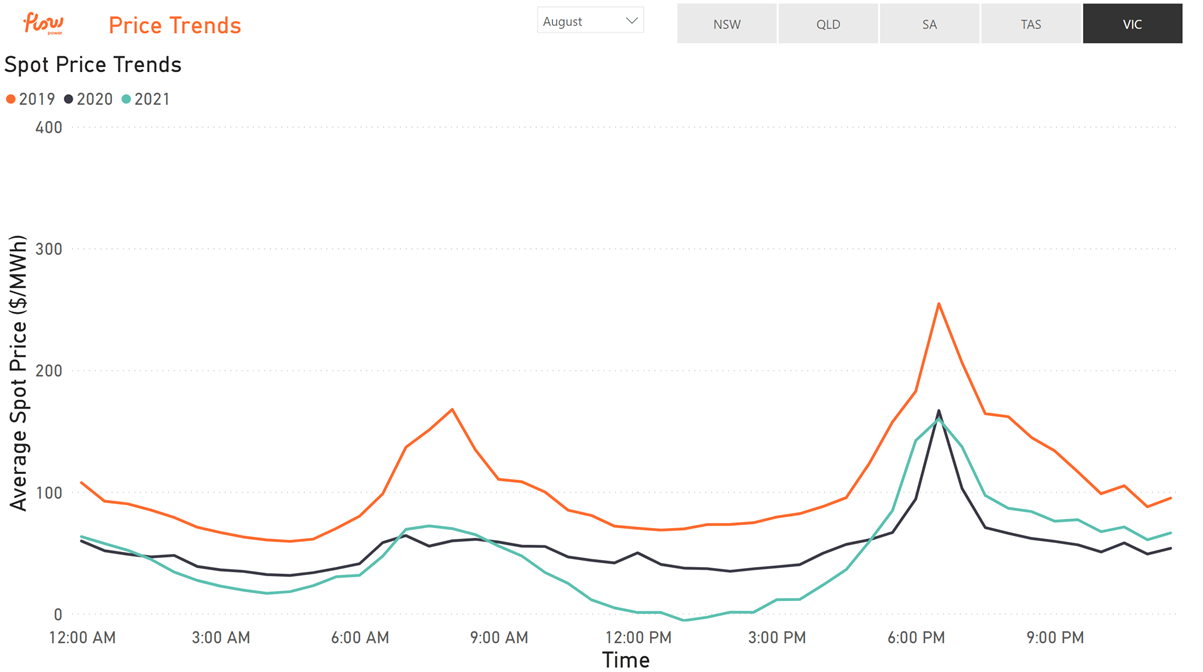
- Year on year peak demand is similar, though the belly of the demand curve (corresponding to middle-of-the-day demand) is getting lower – this could be attributed to higher solar generation in the market, with average peak rooftop solar generation increasing by around 25%
- For two days (Sunday the 15th and the 22nd), average spot price for the day was negative
- Average spot price was much lower compared to last month, and even slightly lower than the same month last year
- This is especially the case in the middle of the day, with average prices between 12:00 PM and 02:00 PM being negative for August
The energy price trends for August and what we’re expecting in September
All in all, August has seen a return to somewhat “regular” prices for electricity across the NEM. The prior 3 months have seen generation drop due to both scheduled and unscheduled outages, though availability seems to be at a healthy point now. All regions have seen similar peaks, but lower middle-of-the-day demand – this “deepening belly” is likely a result of the increasing penetration of renewables in the system, and is driving down mid-day prices. This has impacts for customers, as the market previously used to be cheapest in the middle of the night.
In the month of September, forward contract prices are indicative of September seeing similar market prices to August. Generally as Australia moves out of winter, we see a decrease in average demand, and given weather outlooks we would expect similar soft prices (and some negative prices) throughout the month. An important change to the NEM is set to arrive in October (pending AEMO approval), with trading prices moving from the current 30-minute settlement system to a 5-minute settlement system. For more information on what this means and how it might affect prices, see
If you want a more detailed understanding of what happened in the energy market last month, read our Market Wrap for July 2021.
Any questions? Our energy specialists are here to help.
If you’re an existing Flow Power customer, please do not hesitate to reach out to your account manager.
If you’re not a Flow Power customer, feel free to contact our friendly team:
? 1300 08 06 08 (within business hours)
?️ Live chat message (within business hours via the chat button at the bottom of your screen)
Alternatively, you can submit your questions through our website contact form here.