


Can your business utilise South Australia’s unique energy trends?
South Australia’s electricity market has endured years of volatility, that has created some interesting challenges for business owners and customers wishing to take charge of their energy costs. The departure of Northern Power Station in May 2016 and the rapid uptake of rooftop solar have created a rollercoaster for electricity prices in South Australia.
One of the more interesting challenges in South Australia is sustained negative pricing events. South Australia is now a net-exporter of electricity and with its intention to increase its exports by some 400% by 2030, it is hard to see how this volatility will not continue for some time to come.
This document is designed to help your business as a consumer of electricity understand how you can take advantage of this unique situation to continually improve your electricity price outcomes.
South Australia’s electricity demand profile between 2010 – 2017
Let us start with the infamous duck curve. This is the relationship between demand for electricity, the amount of rooftop solar, and the price of electricity throughout the day. We see the continuing decrease in demand in the South Australian market, as the sun shines and rooftop solar meets demand. This reduces the need to buy electricity as the sun shines, which depresses wholesale electricity prices.
The graph below shows this relationship:
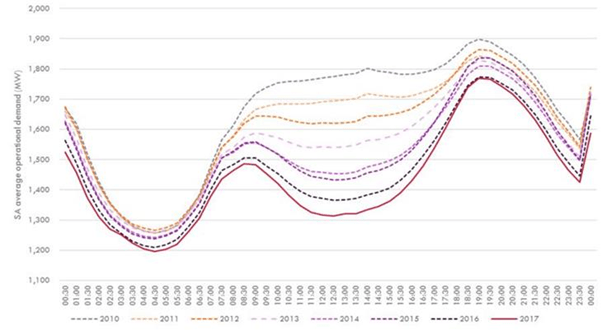
(AEMO: Operational and market challenges to reliability and security in the NEM March 2018)
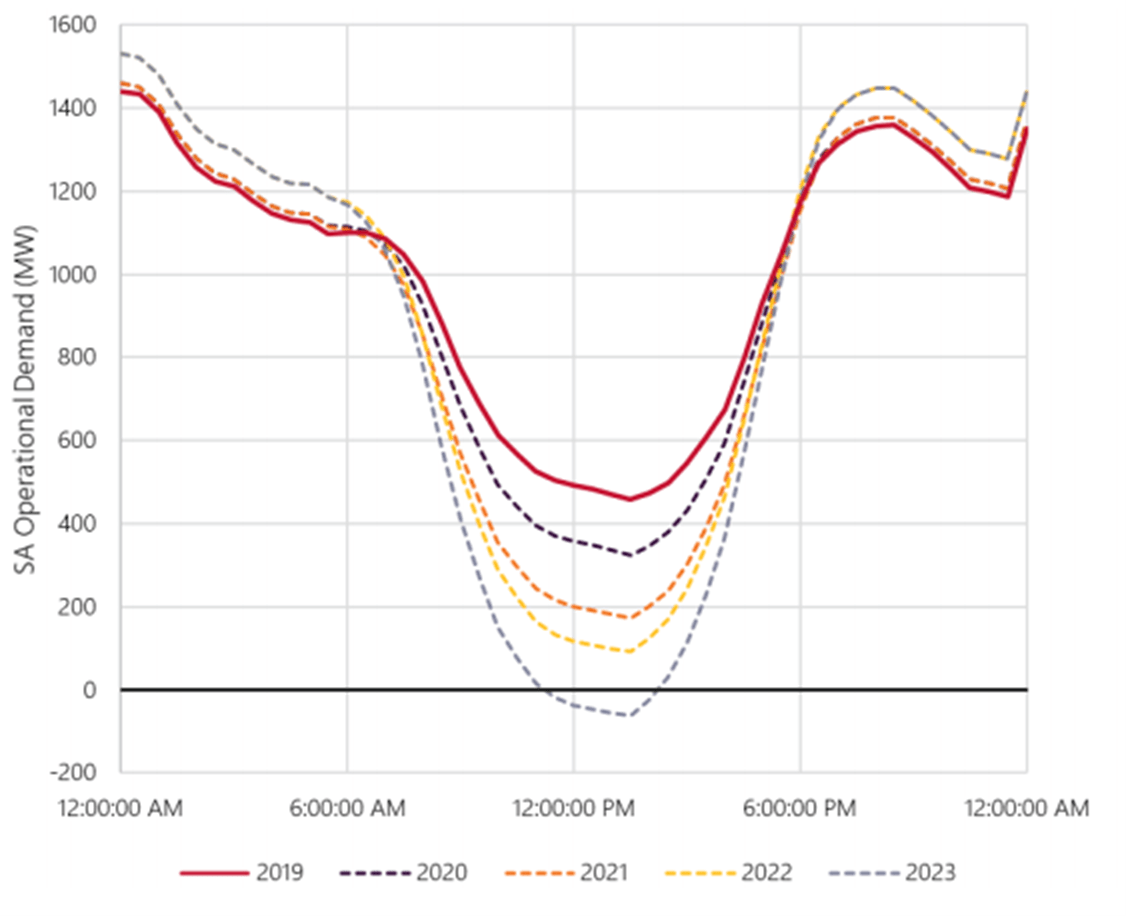
The duck curve trend has only become more pronounced as we look at more recent demand profiles and forecasts from AEMO’s technical report dated May 2020.
Negative Electricity Prices
As customers demand for electricity is met by behind the meter solar, demand to buy electricity evaporates. Once all demand is met, and still more electricity is being created by South Australia’s abundant solar, the price of electricity goes negative as a pricing signal to all generators of electricity to produce less.
These negative pricing events in the South Australian electricity market have been increasing in both frequency and duration over the last 10 years with a significant increase between 2019 – 2021. To understand what is going on, let us look at the duration, timing and frequency of these negative pricing events in more detail.
Duration
As you can see through the two tables below, although negative pricing events are not new to the NEM in South Australia, these have become far more common, and far longer in duration.
| Annual number of hours priced ≤ | ||||||
| Year | QLD | NSW | VIC | SA | TAS | TOTAL |
| 2014 | 8.5 | 0 | 6 | 39.5 | 55 | 109 |
| 2015 | 1.5 | 1 | 14 | 114.5 | 49.5 | 180.5 |
| 2016 | 0.5 | 0 | 90.5 | 197.5 | 213 | 501.5 |
| 2017 | 6.5 | 0 | 3.5 | 69 | 18 | 97 |
| 2018 | 8 | 0 | 34 | 112.5 | 184.5 | 339 |
| 2019 | 149.5 | 5.5 | 66.5 | 402 | 107 | 730.5 |
| 2020 | 350.5 | 34 | 404 | 883 | 253.5 | 1925 |
| 2021 | 0 | 1 | 197.5 | 292.5 | 27.5 | 518.5 |
| TOTAL | 525 | 40.5 | 618.5 | 1818 | 880.5 |
| SA | Duration (hours) | ||||||
| Year | 0.5 | ≥1 | ≥2 | ≥3 | ≥4 | ≥5 | ≥10 |
| 2014 | 0 | 9 | 1 | 4 | 0 | 1 | 0 |
| 2015 | 0 | 20 | 10 | 5 | 3 | 5 | 0 |
| 2016 | 0 | 32 | 11 | 8 | 5 | 11 | 0 |
| 2017 | 0 | 23 | 4 | 2 | 0 | 2 | 0 |
| 2018 | 0 | 11 | 14 | 7 | 2 | 1 | 0 |
| 2019 | 0 | 68 | 21 | 14 | 5 | 20 | 1 |
| 2020 | 0 | 96 | 40 | 26 | 18 | 59 | 5 |
| 2021 | 0 | 15 | 6 | 7 | 4 | 23 | 4 |
It is interesting to note that in 2020 throughout the entire year only 5 negative pricing events exceeded a duration of more than 10 hours. However, already in Q1 of 2021 we have had 4. Equally, the number of events with a duration of between 5-10 hours is rapidly approaching half the number of 2020 in just the first quarter of 2021.
Timing
The principal reason for these negative events is the amount of electricity generated by South Australia’s installed solar panels. This is clearly demonstrated by the timing of these negative events falling during the traditional solar generation curve.
The graph demonstrates how the South Australian electricity market has a clear increase in negative pricing events within the traditional solar generation curve.
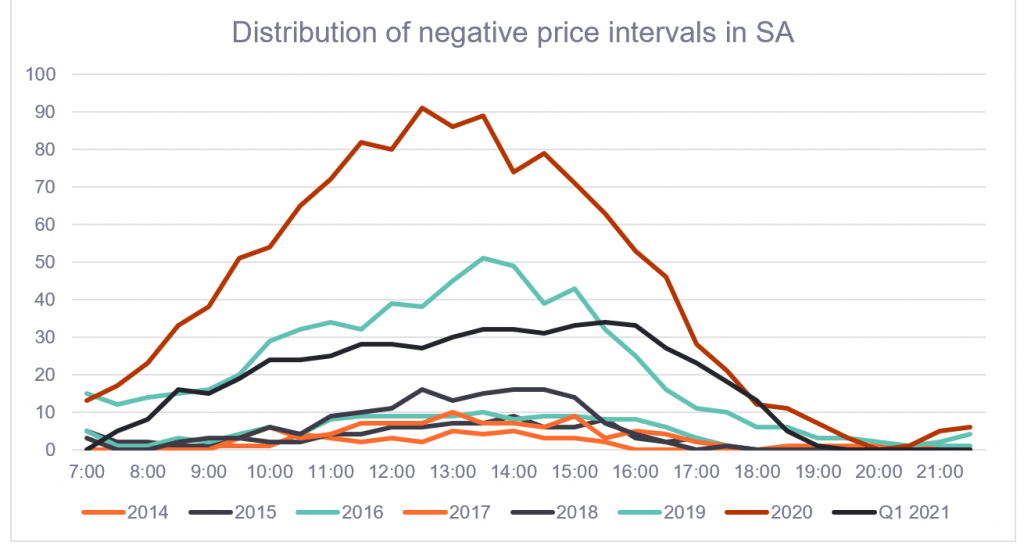
Furthermore, the heat map below is a clear representation of when these events are occurring, and it is no surprise this is during the solar generating hours for most of the time.
| Time | 2014 | 2015 | 2016 | 2017 | 2018 | 2019 | 2020 | Q1 2021 |
| 0:30 | 0 | 0 | 4 | 0 | 0 | 2 | 8 | 0 |
| 1:00 | 1 | 0 | 5 | 0 | 2 | 2 | 11 | 1 |
| 1:30 | 2 | 1 | 11 | 0 | 2 | 7 | 21 | 3 |
| 2:00 | 2 | 10 | 14 | 0 | 3 | 5 | 31 | 4 |
| 2:30 | 4 | 12 | 17 | 0 | 5 | 6 | 37 | 5 |
| 3:00 | 4 | 15 | 23 | 1 | 5 | 11 | 43 | 7 |
| 3:30 | 6 | 19 | 29 | 3 | 7 | 17 | 47 | 9 |
| 4:00 | 4 | 17 | 32 | 6 | 9 | 14 | 56 | 11 |
| 4:30 | 6 | 17 | 34 | 6 | 11 | 19 | 47 | 6 |
| 5:00 | 4 | 15 | 30 | 5 | 8 | 16 | 40 | 5 |
| 5:30 | 1 | 12 | 20 | 7 | 8 | 10 | 33 | 2 |
| 6:00 | 0 | 10 | 11 | 5 | 5 | 12 | 27 | 0 |
| 6:30 | 3 | 6 | 5 | 2 | 3 | 19 | 20 | 0 |
| 7:00 | 0 | 5 | 5 | 0 | 3 | 15 | 13 | 0 |
| 7:30 | 0 | 2 | 1 | 0 | 0 | 12 | 17 | 5 |
| 8:00 | 1 | 2 | 1 | 0 | 0 | 14 | 23 | 8 |
| 8:30 | 1 | 1 | 3 | 0 | 2 | 15 | 33 | 16 |
| 9:00 | 1 | 1 | 2 | 0 | 3 | 16 | 38 | 15 |
| 9:30 | 1 | 3 | 4 | 3 | 3 | 20 | 51 | 19 |
| 10:00 | 1 | 2 | 6 | 6 | 6 | 29 | 54 | 24 |
| 10:30 | 4 | 2 | 4 | 3 | 4 | 32 | 65 | 24 |
| 11:00 | 3 | 4 | 8 | 4 | 9 | 34 | 72 | 25 |
| 11:30 | 2 | 4 | 9 | 7 | 10 | 32 | 82 | 28 |
| 12:00 | 3 | 6 | 9 | 7 | 11 | 39 | 80 | 28 |
| 12:30 | 2 | 6 | 9 | 7 | 16 | 38 | 91 | 27 |
| 13:00 | 5 | 7 | 9 | 10 | 13 | 45 | 86 | 30 |
| 13:30 | 4 | 7 | 10 | 7 | 15 | 51 | 89 | 32 |
| 14:00 | 5 | 9 | 8 | 7 | 16 | 49 | 74 | 32 |
| 14:30 | 3 | 6 | 9 | 6 | 16 | 39 | 79 | 31 |
| 15:00 | 3 | 6 | 9 | 9 | 14 | 43 | 71 | 33 |
| 15:30 | 2 | 8 | 8 | 3 | 7 | 32 | 63 | 34 |
| 16:00 | 0 | 3 | 8 | 5 | 4 | 25 | 53 | 33 |
| 16:30 | 0 | 2 | 6 | 4 | 2 | 16 | 46 | 27 |
| 17:00 | 0 | 3 | 3 | 2 | 0 | 11 | 28 | 23 |
| 17:30 | 0 | 1 | 1 | 1 | 1 | 10 | 21 | 18 |
| 18:00 | 0 | 0 | 0 | 0 | 0 | 6 | 12 | 13 |
| 18:30 | 0 | 0 | 0 | 1 | 0 | 6 | 11 | 5 |
| 19:00 | 0 | 0 | 1 | 1 | 0 | 3 | 7 | 1 |
| 19:30 | 0 | 0 | 0 | 1 | 0 | 3 | 3 | 0 |
| 20:00 | 0 | 0 | 0 | 1 | 0 | 2 | 0 | 0 |
| 20:30 | 0 | 0 | 0 | 1 | 0 | 1 | 1 | 0 |
| 21:00 | 1 | 0 | 1 | 0 | 0 | 2 | 5 | 0 |
| 21:30 | 0 | 0 | 1 | 0 | 0 | 4 | 6 | 0 |
| 22:00 | 0 | 1 | 2 | 3 | 0 | 1 | 16 | 0 |
| 22:30 | 0 | 0 | 8 | 1 | 2 | 5 | 17 | 0 |
| 23:00 | 0 | 0 | 7 | 2 | 0 | 8 | 19 | 1 |
| 23:30 | 0 | 4 | 6 | 1 | 0 | 6 | 16 | 0 |
| 0:00 | 0 | 0 | 2 | 0 | 0 | 0 | 3 | 0 |
Frequency
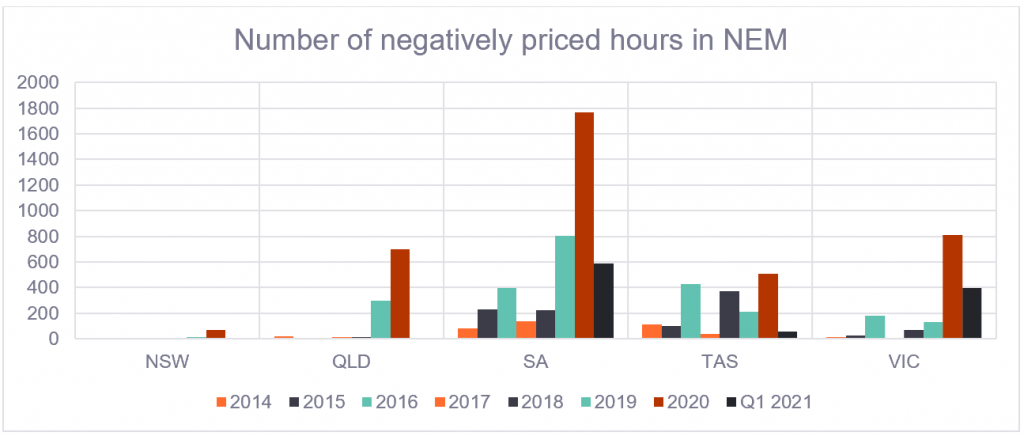
The graph below displays the total number of negative priced hours in the National Electricity Market for the last 7 years 2014 – 2021. This demonstrates the clear disparity between the South Australian electricity market and the other states in the National Electricity Market in terms of volume of negative hours of pricing.
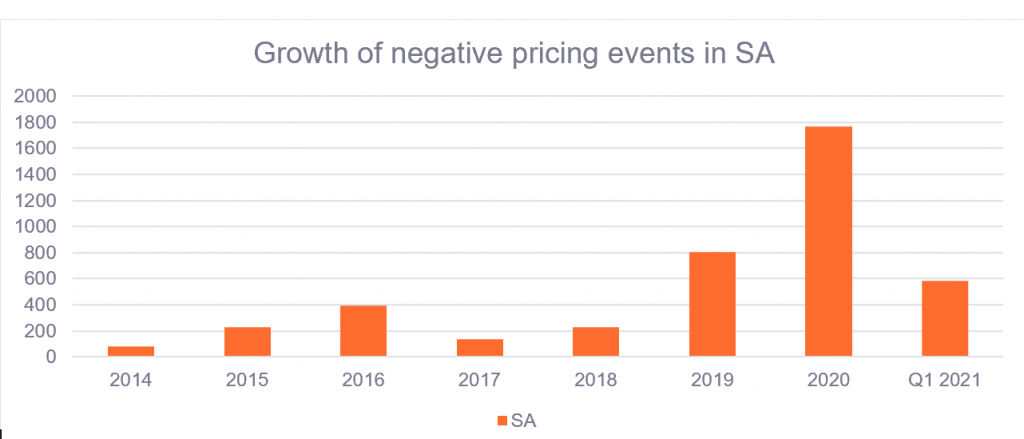
The chart below demonstrates how the South Australian market has seen a dramatic increase in negative pricing events. At first 2020 appeared to be an anomaly, however Q1 2021 shows that 2021 is heading in a very similar direction thus far.
Other factors
Negative pricing has attracted a lot of attention, so there are other factors that can, or could affect the frequency in South Australia. Current proposals to build an interconnector between South Australia and NSW mean that more electricity can be exported out of South Australia, which will raise demand, potentially limiting the negative pricing events. However, given the continued take up of rooftop solar PV there will continue to be volatility and negative pricing events for some time.
Another factor to consider is the ability to remotely control residential rooftop solar PV which is currently under investigation. This remote-control mechanism is to be used to help electrical grid stability and is not intended to shut down rooftop solar for long periods or very often.
Negative prices and your business
There are several strategies that businesses can adopt to capture the value that these negative price events offer. Most businesses purchase electricity at fixed peak, off peak and perhaps shoulder rates. These fixed rates and defined times limit business’ ability to be dynamic in the face of changing, or even negative prices. Therefore, the most critical strategy for businesses is to be on a retail electricity sale agreement that passes on in some way the changing nature of the wholesale electricity price. Once this dynamic pricing is opened, businesses can capture the value of these negative events in several ways, either through batteries or load shifting
Dynamic Pricing
Most standard retail contracts include peak and off-peak rates. Typically, peak rates are charged between 7am-10pm on weekdays. This timing historically represented the higher and lower priced times of the day on the market that retailers buy your energy from.
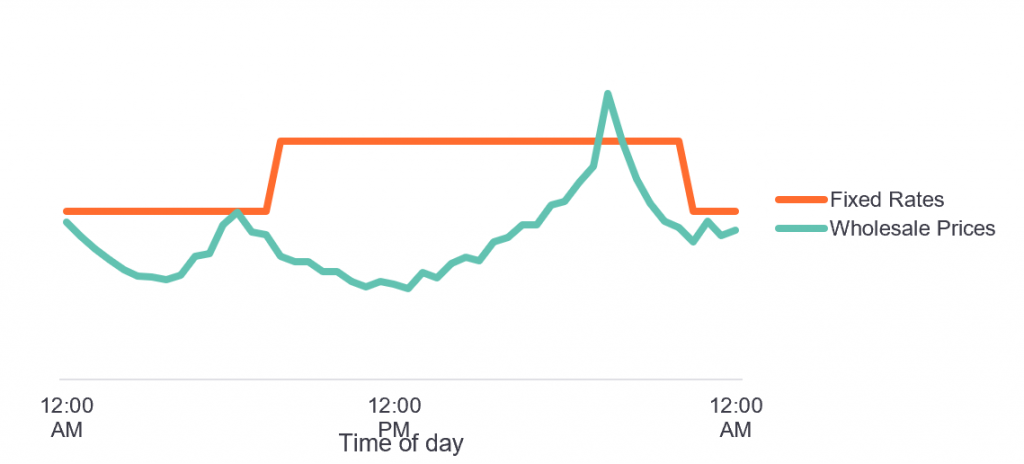
As we have seen the record amount of solar generation entering the grid is changing how the market peaks and drops. Prices are typically highest for a few hours in the morning and late afternoon and are often cheapest throughout the day. This new off-peak period in the middle of the day is inaccessible under a standard retail contract.
Flow Power can help businesses access this dynamic pricing cycle by calculating how much energy you use when the market is peaking, we then pass through your performance as an adjustment to your rate. High usage at low price times means a low load adjustment, or discount to your initial contract rate. The graph below highlights the fixed peak and off-peak rates vs the duck curve we saw earlier with low day time pricing.
Batteries
Once your business is free from the fixed rates, capturing low energy prices becomes possible. Charging batteries at times of cheap electricity is a one way to help take advantage of cheaper prices for longer periods of the day. Normal operations can continue while cheaper daytime solar produced power is abundant in the market, while the expensive peak demand at the beginning and end of the day can be serviced by onsite batteries that were charged at times of low prices.
Load Shifting
Another approach to managing your business’s electricity cost is to shift the time you consume electricity to cheaper periods of the day. Once your business has access to changing electricity prices you can priorities high demand operations at times of cheaper prices.
Questions about South Australia’s unique energy market?
The authors of this research paper are here to help:
Nick Mercure, Corporate Energy Specialist
Email: nick.mercure@flowpower.com.au
James McFarlane, Technical Business Energy Manager
Email: james.mcfarlane@flowpower.com.au