


As we all know, this year, May was not our typical autumn month with mild weather conditions and steady electricity bills. In fact, the wholesale electricity market saw some very volatile trends in this generally stable month.
The fact that more than usual trading prices hit higher “peak” prices, was especially strange considering the pleasant summer months we’ve had this year.
So what’s the reason behind these unusual energy price spikes in May? Actually, it’s a combination of multiple reasons, so bear with us as we explain the month that was.
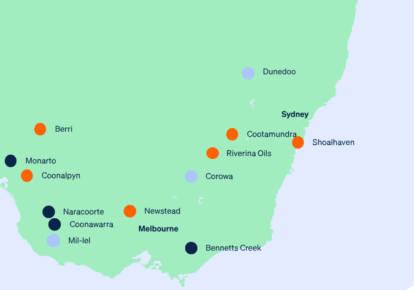
In the NEM, New South Wales and Queensland are bordering, so their prices are sometimes related to each other. Let’s examine them first.
Let’s start with a bit of terminology. When we say Underlying spot below, we mean prices capped to $300/MWh. If a price is $450, that means the Underlying spot would be $300, and the Cap Payout would be $150 (that is, the amount of “overfill” price above $300). These terms are generally used when talking about contract spot prices and have an impact on trading spot prices, so we’ll use them here as well. For those interested in why there are different components of price, we plan to put out an explanatory article soon.
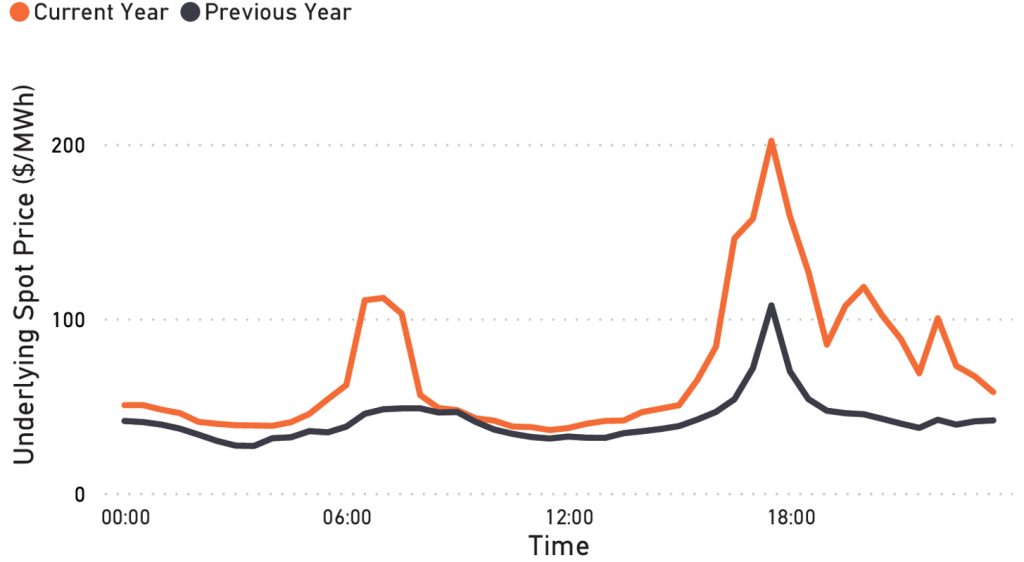
Looking at NSW first, the graph above shows the average underlying spot price for each daily time interval. What we can see is that prices this May are generally higher across the board than last May but are significantly higher during the morning and evening peaks.
This is generally when people get up (and shower or have breakfast) or get home from work or school. In both cases, this could also be when people are turning on their home heaters – increased power usage generally means higher prices.
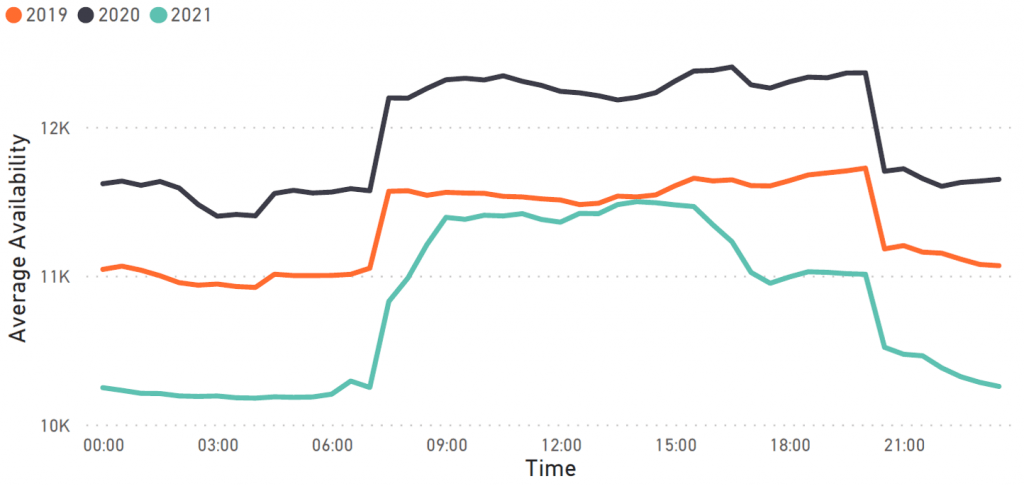
If we examine availability (what generators say they can produce) and demand (how much power is consumed) for the month, we can see that 2021 has some clear differences to previous years. This leads to one of the main drivers of price volatility:
Decreased Supply/Demand Gap
Like any market, prices are related to supply and demand – if there’s a much larger supply, then prices are likely to be cheaper, similarly if there’s not enough excess supply (which can be caused by low supply, or higher demand), then prices are likely go up.
What we can see is that in 2021, availability was a fair bit lower in NSW than in previous years. This was caused by a series of generator outages. Normally, generators need to go offline for periods of time for regular maintenance, but sometimes they can have unexpected outages (let’s say, if there’s a gas leak or something suddenly explodes). In the month of May, a combination of regular maintenance and unexpected outages led to lower availability than normal.
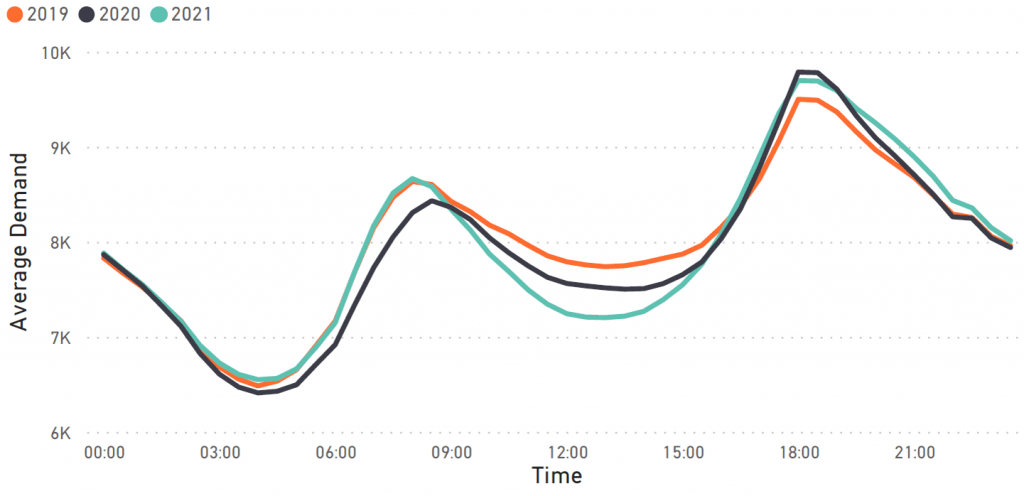
The graph on the right shows the average demand curve throughout different times of the day. What we can see is that compared to previous years, May 2021 had similar or higher demand during the peak periods, but lower demand during the middle of the day. This deepening belly of the curve is a trend being seen in demand curves worldwide and is likely caused by increased rooftop solar generation – as more people get household solar, the reliance on the electricity network in the middle of the day (when rooftop solar generates more energy) tends to be lower.
When we combine the two graphs above, we can see that during peak times, we have similar or higher demand, but decreased supply. This is likely a contributing factor to price volatility.
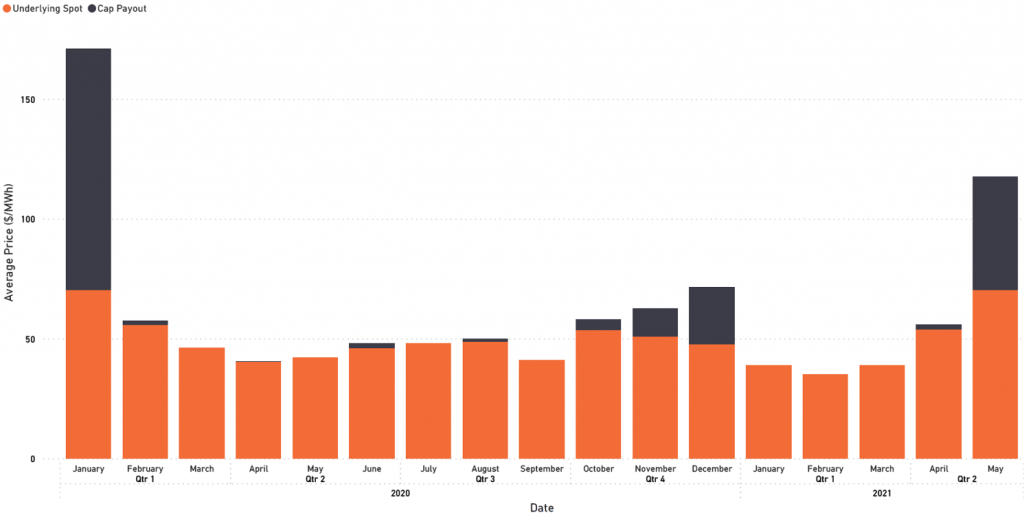
By examining monthly averages, we can see that the prices in May were much higher than anything in the previous year of prices. The high cap payout indicates that there was a high amount of “price spikes” in the month, but even the higher underlying spot means that non-spike prices were also generally higher.
Similarly, the prices in the first three months this year were lower than prices last year – this leads to another potential reason for high prices in May:
Generator Bidding Strategies
AEMO sets the overall trading price for electricity every half hour, but they get their prices by organising the bids of electricity generators. Low prices are a result of generators bidding lower prices for the power they generate, and conversely high prices are a result of them bidding higher.
As prices were lower than average in the first quarter of the year, prices tend to be higher than average following that. Generators are privately owned businesses too, so have their own financial targets to make before the end of the financial year.
Queensland
- Lower generation in 2021 than 2020, along with similar or higher demand in the morning and evening peaks is likely a contributing factor to price volatility
- Similar gentle price trends in the start of 2021 contributing to higher prices in May
- Explosion at Callide Power Station on the 25th of May caused a large, sustained price spike in QLD, contributing to the larger Cap Payout
South Australia
- High cap payout in March accompanies a low underlying spot – this likely indicates a high, unexpected spike (rather than sustained price volatility) as a result of the Torrens Island Substation fire on the 12th of March
- Lower availability, but lower evening demand resulting in less intense price volatility
- Lower underlying spot in the first quarter of 2021 contributing to higher prices in May
- Deepening afternoon demand causing average price fall in the middle of the day
Victoria
- Similar or increased demand but less of an availability drop compared to other regions could have decreased price volatility in Victoria
- Lower prices in the first quarter contributing to higher prices in May
- Decreasing demand in the middle of the day likely reducing afternoon prices
Conclusion
Looking at the month of May 2021, in comparison to May 2020, we can see that there have been more high price events than expected for this time of year (especially in NSW and QLD). However, even when discounting the spikes, underlying spot prices have also been higher. By examining an intra-day spot price profile, we can see that these higher average spot prices are primarily caused by higher prices during the morning and evening peaks, rather than overall.
NSW and QLD showed fairly significant (1000 MW) declines in availability from 2020, likely due to various baseload generator outages throughout the month (both planned and unplanned) which is likely to have significantly impacted prices throughout the month. By looking at the intra-day demand curve, we can see that demand during peak hours isn’t changing much, though the “belly” of the demand curve is dropping further (likely due to an increase in rooftop solar).
Moving forwards into June, supply should pick up again as generators complete routine maintenance and come back online around the middle of the month. This increased supply should relieve pressure on the network and decrease price volatility. However, this rise in supply would match the general rise in demand that tends to accompany June (as it gets colder), so prices might remain high for the month. Additionally, price trends based on bidding tend to be quarterly-focused, so some market volatility may stick around until the start of July.
Any questions? Our energy specialists are here to help.
If you’re an existing Flow Power customer, please do not hesitate to reach out to your account manager.
If you’re not a Flow Power customer, feel free to contact our friendly team:
? 1300 08 06 08 (within business hours)
?️ Live chat message (within business hours via the chat button at the bottom of your screen)
Alternatively, you can submit your questions through our website contact form here.